Introduction
Respiratory infections remain a major global health burden. Lower respiratory infections remain the world's leading infectious cause of death and were responsible for an estimated 2.50 million deaths in 2023[1]. Meanwhile, the co-circulation of respiratory pathogens, including SARS-CoV-2, influenza A/B, and respiratory syncytial virus, has increased the demand for rapid and reliable multiplex etiological testing[2,3]. In this study, respiratory syncytial virus (RSV), human metapneumovirus subtype B (hMPV-B), Streptococcus pneumoniae (SPN), Bordetella pertussis (BP), and Haemophilus influenzae (HI) were selected as representative respiratory targets. Rapid and sequence-specific pathogen identification is therefore important for earlier etiological differentiation and timely infection-control decisions.
Current respiratory pathogen detection technologies involve different trade-offs between analytical performance and practical accessibility. Laboratory nucleic-acid amplification tests, particularly real-time quantitative PCR (qPCR), provide high analytical sensitivity and specificity, but conventional workflows often depend on nucleic-acid extraction, thermal cycling, specialized instrumentation, and trained personnel, limiting their use in decentralized or point-of-care settings[2,4]. Rapid antigen tests are easier to deploy, but their clinical sensitivity can vary with pathogen load and the timing of testing[4]. We therefore focused on RPA–CRISPR/Cas12a as a promising strategy for combining molecular specificity with point-of-care compatibility. In this system, recombinase polymerase amplification (RPA) first amplifies the target sequence under isothermal conditions, while CRISPR/Cas12a provides a second layer of sequence recognition through crRNA-guided target identification and collateral cleavage. This sequential amplification-and-recognition process provides a dual-recognition mechanism that combines target enrichment with programmable sequence specificity. Recent RPA–CRISPR/Cas12a methods have already demonstrated rapid and sensitive detection of viral nucleic acids and compatibility with portable point-of-care readout platforms[5-8]. The wet-lab principle of the RPA–CRISPR assay is illustrated in Figure 1.

However, integrating the RPACRISPR systems into a single tube to establish a singlestep RPACRISPR/Cas12a detection platform still requires extensive optimization and faces multiple unresolved challenges. Cas12a activation and trans-cleavage are strongly target-dependent; bases in the PAM region, sequences within and outside regions complementary to the crRNA spacer, DNA topology, target length, and other target-context features can substantially affect activation kinetics[9]. Cas12a activity is also sensitive to crRNA sequence and architecture, further increasing the importance of rational crRNA design[10]. In one-pot formats, nucleic-acid amplification and CRISPR cleavage can also be incompatible, requiring deliberate reaction-system design and condition optimization to achieve effective coupling[11-13]. These factors can necessitate iterative experimental screening when a new target is introduced.
To address these technical limitations, this study used respiratory syncytial virus N gene as a basic model and a model plasmid carrying RSV N gene fragment to establish a multidimensional, coordinated optimization framework with a spiral DBTL iterative-feedback mechanism. First, DNABERT-6 was used to efficiently screen RPA primer and crRNA combination candidates at the sequence level. Recent studies have demonstrated the potential of deep-learning-based crRNA design and DNA foundation models for sequence-based prediction and candidate prioritization[14,15]. RPA primer -crRNA combination performance was then experimentally validated and fed back into the drylab model, completing the first closed-loop optimization. Second, an enzymatic kinetic model was introduced to predict the matching relationships among the ranges of each reaction parameter and the dynamic characteristics of signal generation. Recent CRISPR diagnostic studies have further demonstrated the utility of computational analysis and real-time reaction kinetics for extracting and optimizing diagnostic information[16,17]. Wet-lab validation was subsequently adopted for experimental verification and calibration of model parameter ranges, to further iterate and optimize the dry-lab model, completing the second closed-loop optimization. Finally, the optimized workflow was extended to four additional respiratory pathogens. Following the core Design–Build–Test–Learn concept, we established a spiral closed-loop optimization system integrating algorithmic prediction, mechanistic analysis, simulation-based optimization, and experimental validation, as shown in Figure 2.

BOX OF MEASUREMENT:
1. Quantitative and Qualitative Detection:
Sensitivity was evaluated through serial dilution of plasmid concentrations to quantitatively determine the limit of detection of pathogen nucleic-acid template.
Our instrument acquires and outputs the complete detection results, simultaneously displaying real-time fluorescence kinetic curves and endpoint fluorescence values, while also providing fluorescence photographs of the corresponding reaction tubes.
For detailed experimental protocols and results for quantitative and qualitative detection, see the linked Sections 3.1, 4.2.1, 5.2.1, 6.2.1, 7.2.1, and 8
2. Reproducibility Measurement:
Reproducibility was evaluated using independent parallel experiments performed by multiple operators at different time points, and assay stability was assessed based on the magnitude of signal variation.
For the detailed protocol and results on reproducibility, see the linked Sections 3.3, 4.2.3, 5.2.3, 6.2.3, and 7.2.3
3. Measurement of Resistance to Matrix Interference:
To simulate a realistic throat-swab testing scenario, plasmids were serially diluted in an aqueous saliva-lysis-buffer matrix, and the ability of the assay to resist interference from salivary impurities was evaluated.
For the detailed protocol and results on resistance to matrix interference, see the linked Sections 3.4, 4.2.4, 5.2.4, 6.2.4, and 7.2.4
4. Controls and Calibration:
Controls: plasmid was used as the positive control, and ddH2O was used as the blank control; other pathogens served as negative controls.
Calibration: the experiment was calibrated against the standard qPCR method.
For the detailed protocol and results on calibration, see the linked Sections 3.5, 4.2.5, 5.2.5, 6.2.5, and 7.2.5
To provide an at-a-glance overview of the logical framework of our Measurement project, we designed a Measurement tree; clicking any element navigates directly to the corresponding section.
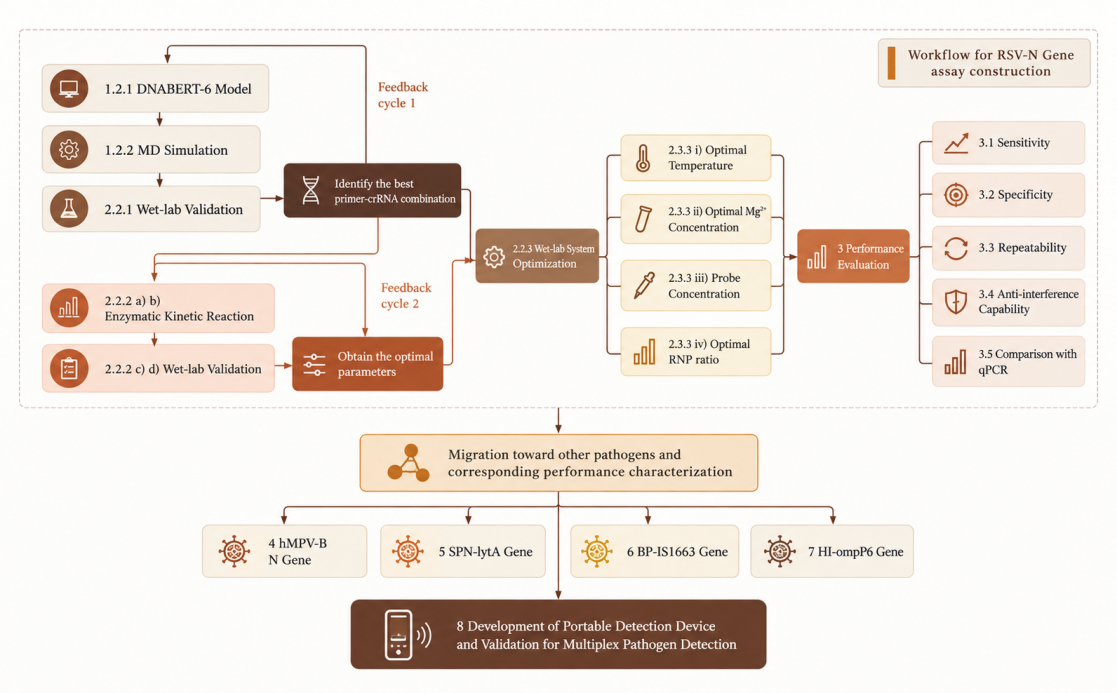 Workflow for RSV-N Gene assay construction
1.2.1 DNABERT-6 Model
1.2.2 MD Simulation
2.2.1 Wet-lab Validation
Identify the best primer-crRNA combination
Enzymatic Kinetic Reaction
Wet-lab Validation of reaction components
Obtain the optimal parameters
Wet-lab System Optimization
Optimal Temperature
Optimal Mg2+ Concentration
Probe Concentration
Optimal RNP ratio
Performance Evaluation
Sensitivity
Specificity
Repeatability
Anti-interference Capability
Comparison with qPCR
Migration toward other pathogens
hMPV-B N Gene
SPN-lytA Gene
BP-IS1663 Gene
HI-ompP6 Gene
Development of Portable Detection Device
Workflow for RSV-N Gene assay construction
1.2.1 DNABERT-6 Model
1.2.2 MD Simulation
2.2.1 Wet-lab Validation
Identify the best primer-crRNA combination
Enzymatic Kinetic Reaction
Wet-lab Validation of reaction components
Obtain the optimal parameters
Wet-lab System Optimization
Optimal Temperature
Optimal Mg2+ Concentration
Probe Concentration
Optimal RNP ratio
Performance Evaluation
Sensitivity
Specificity
Repeatability
Anti-interference Capability
Comparison with qPCR
Migration toward other pathogens
hMPV-B N Gene
SPN-lytA Gene
BP-IS1663 Gene
HI-ompP6 Gene
Development of Portable Detection Device
Workflow links
- Workflow for RSV-N Gene assay construction
- 1.2.1 DNABERT-6 Model
- 1.2.2 MD Simulation
- 2.2.1 Wet-lab Validation
- Identify the best primer-crRNA combination
- Enzymatic Kinetic Reaction
- Wet-lab Validation of reaction components
- Obtain the optimal parameters
- Wet-lab System Optimization
- Optimal Temperature
- Optimal Mg2+ Concentration
- Probe Concentration
- Optimal RNP ratio
- Performance Evaluation
- Sensitivity
- Specificity
- Repeatability
- Anti-interference Capability
- Comparison with qPCR
- Migration toward other pathogens
- hMPV-B N Gene
- SPN-lytA Gene
- BP-IS1663 Gene
- HI-ompP6 Gene
- Development of Portable Detection Device
1 Design and Synthesis of Biological Components
1.1 Design of the LbCas12a Expression Construct
LbCas12a (LbCpf1) derived from Lachnospiraceae bacterium ND2006 was selected as the target protein. Reverse translation was performed based on its amino acid sequence, followed by synonymous codon optimization tailored for the Escherichia coli expression system. While preserving the original amino acid sequence of LbCas12a, sequence-level adaption optimization was conducted on the coding sequence to obtain the LbCas12a CDS for recombinant expression in E. coli. The final designed CDS is 3741 bp in length, including a terminal TAA stop codon, and encodes the 1246 aa LbCas12a protein.
On this basis, the recombinant expression vector for LbCas12a was designed with reference to the pET28a expression backbone. The expression module adopts the T7/lac regulatory system and comprises the ribosome-binding region, an N-terminal His₆ tag, a TEV protease cleavage site, the codon-optimized LbCas12a CDS, and a downstream region carrying the T7 terminator. The His₆ tag facilitates subsequent Ni-NTA affinity purification, whereas the TEV cleavage site enables controllable removal of the fusion tag.
The resulting expression vector design was designated pET28a-TEV-LbCas12a. This construct establishes a recombinant expression framework of LbCas12a compatible with E. coli BL21(DE3).
Table 1 Basic Information on LbCas12a
| Parameter | Data |
|---|---|
| Protein | LbCas12a / LbCpf1 |
| Source | L. bacterium ND2006 |
| Expression vector | pET28a-TEV |
| Expression host | E. coli BL21(DE3) |
| Promoter | T7 |
| Affinity tag | N-terminal His₆ tag |
| Protease site | TEV |
| Protein length | 1246 aa |
| CDS length | 3741 bp |
| GC content | 50.41% |
| Theoretical MW | 145.64 kDa |

1.2 Design and Synthesis of Primers and crRNA
1.2.1 High-Throughput Prediction of Primer-crRNA Combinations for the RSV-N Gene Using the DNABERT-6 Model
a) Construction of the DNABERT-6 Model
The workflow of the DNABERT-6 model is shown in Figure 4. For further details on model construction and execution, please visit our Dry Lab Model page.

b) Primer-crRNA Combination Screening and Ranking
DNABERT-6 model screened 10 primer combinations with excellent overall performance and evaluated each combination; the candidates were ranked according to their composite scores, as shown in Table 2.
Table 2 Candidate primer-crRNA sequences and quality scores output by DNABERT-6
| Component | Sequence (5′→3′) | Length (nt) |
|---|---|---|
| Candidate 1 Normalized Quality Score Q = 0.9943 | ||
| Forward primer F | TGCAGGATTGTTTATGAATGCCTATGGTTC | 30 |
| Reverse primer R | AGAATCCAGCTTCTCCTCCCAACTTCTGTGC | 31 |
| Target crRNA | TTTCTGCCTGGACACTAGCATGAC | 24 |
| Candidate 2 Normalized Quality Score Q = 0.9455 | ||
| Forward primer F | ACAAGAGGGGGTAGTAGAGTTGAAGGAATC | 30 |
| Reverse primer R | ATGACTTCCACAACTTGCTCCATTTCTGCC | 30 |
| Target crRNA | TTTACAGATTTGGCTAAAACTCCC | 24 |
| Candidate 3 Normalized Quality Score Q = 0.9251 | ||
| Forward primer F | TTTGGCATTGCACAATCATCAACAAGAGGGG | 31 |
| Reverse primer R | AACTTGCTCCATTTCTGCCTGGACACTAGC | 30 |
| Target crRNA | TTTACAGATTTGGCTAAAACTCCC | 24 |
| Candidate 4 Normalized Quality Score Q = 0.8850 | ||
| Forward primer F | TTTGGCATTGCACAATCATCAACAAGAGGGG | 31 |
| Reverse primer R | AACTTGCTCCATTTCTGCCTGGACACTAGCA | 31 |
| Target crRNA | TTTACAGATTTGGCTAAAACTCCC | 24 |
| Candidate 5 Normalized Quality Score Q = 0.8268 | ||
| Forward primer F | GGCATTGCACAATCATCAACAAGAGGGGGT | 30 |
| Reverse primer R | AACTTGCTCCATTTCTGCCTGGACACTAGC | 30 |
| Target crRNA | TTTACAGATTTGGCTAAAACTCCC | 24 |
| Candidate 6 Normalized Quality Score Q = 0.7863 | ||
| Forward primer F | GGGAGGAGAAGCTGGATTCTACCATATATTG | 31 |
| Reverse primer R | GCTTTGGCTGCATCATAAAGATCCTGGTTTC | 31 |
| Target crRNA | TTTCTTGGCGTACCTCTATACTCT | 24 |
| Candidate 7 Normalized Quality Score Q = 0.7800 | ||
| Forward primer F | GGCATTGCACAATCATCAACAAGAGGGGGT | 30 |
| Reverse primer R | AACTTGCTCCATTTCTGCCTGGACACTAGCA | 31 |
| Target crRNA | TTTACAGATTTGGCTAAAACTCCC | 24 |
| Candidate 8 Normalized Quality Score Q = 0.7698 | ||
| Forward primer F | TGGCTCCAGAATATAGGCATGATTCTCCAG | 30 |
| Reverse primer R | CCTTTGGTATGAGACCCTTGTAGCGTTTTAT | 31 |
| Target crRNA | TTTGCCCTCCTAATTACTGCTGTA | 24 |
| Candidate 9 Normalized Quality Score Q = 0.7581 | ||
| Forward primer F | GGCTCCAGAATATAGGCATGATTCTCCAGAC | 31 |
| Reverse primer R | CCTTTGGTATGAGACCCTTGTAGCGTTTTAT | 31 |
| Target crRNA | TTTGCCCTCCTAATTACTGCTGTA | 24 |
| Candidate 10 Normalized Quality Score Q = 0.7338 | ||
| Forward primer F | CATCAACAAGAGGGGGTAGTAGAGTTGAAGG | 31 |
| Reverse primer R | CTCATAGACTTCCACAACTTGCTCCATTTC | 30 |
| Target crRNA | TTTCTGCCTGGACACTAGCATGAC | 24 |
2 Construction and Optimization of the Detection System
2.1 Construction of the RPA-CRISPR Cascade-Amplification Detection System
The combined RPA-CRISPR/Cas12a detection system consists of an RNP premix, an RPA premix, and the final CRISPR detection mixture. Reactions were performed at 40 °C; the instrument was set to 50 cycles and fluorescence signals were collected in real time. Detailed formulation parameters are provided in Table 3 below.
Table 3 Preparation parameters for each reaction component of the RPA-CRISPR/Cas12a cascade-amplification detection system
| Module | Component | Volume Added (μL) |
|---|---|---|
| RNP Reaction Mixture | gRNA(crRNA) | 0.15 |
| Cas12a protein | 0.15 | |
| NE Buffer | 0.25 | |
| DEPC water | 0.25 | |
| RNP premix | Total volume: 0.8 μL; pre-incubate at 37 °C for 30 min | |
| RPA Premix | F forward primer | 4.39 |
| R reverse primer | 4.39 | |
| Nuclease-free water | 23.22 | |
| RPA premix | Total volume: 32 μL; aliquot into 4 tubes, adding 7 μL to the bottom of each tube | |
| Final CRISPR Detection Mixture | RNP | 0.8 |
| ssDNA reporter | 0.15 | |
| Mg2+(MgSO4) | 3 | |
| ddH2O | 3.05 | |
| CRISPR premix | Total volume: 7 μL | |
| Positive control | Plasmid template | 1 |
| Negative control | Nuclease-free water | 1 |
| Total Volume per Reaction Tube | Total volume per tube: 15 μL (7 μL RPA at the bottom of the tube, 7 μL CRISPR onto the inner wall, and 1 μL plasmid/water) | |
Note: the recombinase, polymerase, and single-stranded DNA-binding protein required for the experiment are contained in the lyophilized reagent pellet.
2.2 Optimization of the Reaction System Based on the DBTL Cycle
2.2.1 Candidate Primer-crRNA Combination Optimization
a) Experimental Design
To validate the ranking of primer-crRNA combinations designed for the RSV N gene by the DNABERT-6 model, the top three predicted candidates were experimentally tested using the combined RPA-CRISPR/Cas12a detection system, with only the primer-crRNA combination varied and all other reaction conditions held constant. The candidate ranked tenth was additionally tested to assess the reliability and discriminatory power of the model ranking.
Table 4 DNABERT-6-predicted candidate primer-crRNA sequences selected for validation
| Component | Sequence (5′→3′) | Length (nt) |
|---|---|---|
| Candidate 1 Normalized Quality Score Q = 0.9943 | ||
| Forward primer F | TGCAGGATTGTTTATGAATGCCTATGGTTC | 30 |
| Reverse primer R | AGAATCCAGCTTCTCCTCCCAACTTCTGTGC | 31 |
| Target crRNA | TTTCTGCCTGGACACTAGCATGAC | 24 |
| Candidate 2 Normalized Quality Score Q = 0.9455 | ||
| Forward primer F | ACAAGAGGGGGTAGTAGAGTTGAAGGAATC | 30 |
| Reverse primer R | ATGACTTCCACAACTTGCTCCATTTCTGCC | 30 |
| Target crRNA | TTTACAGATTTGGCTAAAACTCCC | 24 |
| Candidate 3 Normalized Quality Score Q = 0.9251 | ||
| Forward primer F | TTTGGCATTGCACAATCATCAACAAGAGGGG | 31 |
| Reverse primer R | AACTTGCTCCATTTCTGCCTGGACACTAGC | 30 |
| Target crRNA | TTTACAGATTTGGCTAAAACTCCC | 24 |
| Candidate 10 Normalized Quality Score Q = 0.7338 | ||
| Forward primer F | CATCAACAAGAGGGGGTAGTAGAGTTGAAGG | 31 |
| Reverse primer R | CTCATAGACTTCCACAACTTGCTCCATTTC | 30 |
| Target crRNA | TTTCTGCCTGGACACTAGCATGAC | 24 |
b) Experimental Results
All three top-ranked primer-crRNA combinations produced clear fluorescence signals in positive samples, whereas fluorescence readings in the negative controls remained consistently low, with no obvious nonspecific activation. Candidate primer-crRNA combination 2 produced the strongest endpoint fluorescence response and the greatest signal increase. By contrast, candidate primer-crRNA combination 10 showed a delayed fluorescence rise in positive samples, limited signal amplification, and only a small positive-negative signal separation, resulting in markedly poorer overall performance than the top three candidates.

c) Comparison of Dry-Lab and Wet-Lab Results
Wet-lab results showed that all three primer-crRNA combinations ranked in the top three by the dry-lab DNABERT-6 model exhibited excellent detection performance. Among them, the candidate ranked second by normalized quality score achieved the best experimental performance, while the other two top-3 candidates also performed consistently. In contrast, primer-crRNA combination 10 showed weak signal responsiveness and poor separation between positive and negative fluorescence signals. The sequence ranking generated by DNABERT-6 was highly consistent with in vitro wet-lab performance, demonstrating that the model can efficiently conduct high-throughput screening of primer and crRNA sequences for the RPA-Cas12a system.
Accordingly, candidate combination 2 was selected as the optimal primer-crRNA combination for subsequent cycles of optimization and iteration.
d) Significance of the Dry-Lab/Wet-Lab Closed-Loop Iteration
The DNABERT-6 model enables high-throughput, quantitative screening of high-quality primer-crRNA combinations, substantially reducing the trial-and-error cost and experimental time associated with conventional manual design. Wet-lab results further validated the reliability of model scoring, demonstrating strong agreement between model ranking and actual assay performance. At the same time, experimental data were fed back to correct model bias, enabling iterative dry-lab/wet-lab optimization and ultimately identifying the best-performing primer-crRNA combination. This provides a reliable core component for subsequent optimization, performance validation, and real-sample testing of the RPA-CRISPR detection system.
2.2.2 Construction of the Enzymatic Kinetic Model and Optimization of Reaction-Component Ratios
a) Construction of the Enzymatic Kinetic Model
To compare the effects of different reaction conditions on detection signals, we established a reaction kinetic model. The model describes formation of recombinase-primer complexes, reverse transcription, RPA amplification, and CRISPR-Cas12a-mediated reporter cleavage. DNA generated by reverse transcription enters the RPA amplification process, and the amplified target DNA is recognized by the Cas12a-crRNA complex, triggering reporter cleavage. The model tracks changes in the concentrations of major reactants over 25 min and uses these data to search for optimal reaction conditions within predefined ranges. For further details on model construction and execution, click the corresponding buttons to navigate to the relevant sections.

b) Optimization of Reaction-Component Concentrations by Differential Evolution
i) Stage 1 - Global Coarse Search
We first performed a broad global search to identify the concentration ranges of key components affecting the reaction rate. The resulting ranges are shown in Table 5:
Table 5 Concentration Ranges of Reaction Components Obtained by the Global Coarse Search Using Differential Evolution
| Symbol | Value |
|---|---|
| Primer (F) | [0.4862, 0.7262] μM |
| Recombinase (R) | [3.9969, 6.3969] μM |
| Polymerase (P) | [1.1982, 1.8622] μM |
| Gp32 (G) | [0.7534, 1.0334] μM |
| Cas12a/crRNA | [79.2256, 100.0000] μM |
| RT | [37.9946, 40.0000] μM |
ii) Stage 2 - Fine Local Search
Based on the coarse-search results, a fine search was conducted within the optimal concentration ranges to further pinpoint the best reaction conditions. The final optimized component concentrations are shown in Table 6:
Table 6 Optimal Reaction-Component Concentrations Obtained by Fine Local Search Using Differential Evolution
| Symbol | Value |
|---|---|
| Primer (F) | 0.7106 μM |
| Recombinase (R) | 5.8656 μM |
| Polymerase (P) | 1.2016 μM |
| Gp32 (G) | 0.8797 μM |
| Cas12a/crRNA | 81.9139 μM |
| RT | 39.9959 μM |
| Max X(10min) (fine) | 2.629841e-08 M |
For detailed principles and procedures of the enzymatic kinetic model and system-parameter optimization, click the link to our Dry Lab Model page.
c) Validation of Enzyme-Combination Concentration Optimization
i) Experimental Design
Wet-lab validation was performed using the optimal parameters predicted by the enzymatic kinetic model. Recombinase, polymerase, and single-stranded DNA-binding protein are collectively referred to here as the enzyme combination. Five enzyme-combination concentration levels were tested (0.1×, 0.5×, 1.0×, 1.6×, and 2.0×). Substrate concentration, buffer pH, temperature, and other conditions were held constant, and endpoint fluorescence intensity was monitored. If the predicted optimal enzyme-combination concentration produced a significantly higher fluorescence intensity than the other concentration groups, the dry-lab prediction was considered validated; if another concentration yielded stronger fluorescence, the dry-lab model would require further optimization to incorporate additional experimental factors. Reactions were performed at 40 °C, the instrument was set to 50 cycles, and fluorescence signals were collected in real time. Detailed formulation parameters are provided in Tables 7 and 8 below.
Table 7 Amount of ddH2O Added to the Lyophilized Pellet System at Different Enzyme-Combination Concentrations
| Concentration Level | Amount of ddH2O to Be Added to the Lyophilized Pellet |
|---|---|
| 2.0x | 16 μL |
| 1.6x | 20 μL |
| 1.0x | 32 μL |
| 0.5x | 64 μL |
| 0.1x | 320 μL |
Table 8 Preparation parameters for each reaction component in the RPA-CRISPR/Cas12a enzyme-combination concentration validation
| Module | Component | Volume Added (μL) |
|---|---|---|
| RNP Reaction Mixture | gRNA(crRNA) | 0.15 |
| Cas12a protein | 0.15 | |
| NE Buffer | 0.25 | |
| DEPC water | 0.25 | |
| RNP premix | Total volume: 0.8 μL; pre-incubate at 37 °C for 30 min | |
| RPA Premix | F forward primer | 0.96 |
| R reverse primer | 0.96 | |
| Nuclease-free water | 5.08 | |
| RPA premix | Total volume: 7 μL | |
| Final CRISPR Detection Mixture | RNP | 0.8 |
| ssDNA reporter | 0.15 | |
| Mg2+(MgSO4) | 3 | |
| ddH2O | 3.05 | |
| CRISPR premix | Total volume: 7 μL | |
| Positive control | Plasmid template | 1 |
| Negative control | Nuclease-free water | 1 |
| Total Volume per Reaction Tube | Total volume per tube: 15 μL (7 μL RPA at the bottom of the tube, 7 μL CRISPR onto the inner wall, and 1 μL plasmid/water) | |
Note: the recombinase, polymerase, and single-stranded DNA-binding protein required for the experiment are all contained in the lyophilized reagent pellet
ii) Experimental Results
Results obtained across the enzyme-combination concentration gradient (0.1×, 0.5×, 1.0×, 1.6×, 2.0×) showed that the fluorescence response intensities of the 1.0× and 2.0× groups were similar. Considering the appropriate enzyme-concentration parameters identified by dry-lab simulation together with reagent-cost control, we selected 1.0× as the optimal enzyme-concentration setting for subsequent iterative optimization. The results are shown in Figure 6.

d) Validation of Final Primer-Concentration Optimization:
i) Experimental Design:
To validate the optimal final primer concentration predicted by the dry-lab model, six final primer concentrations were tested in the wet lab (0.3 μM, 0.4 μM, 0.5 μM, 0.6 μM, 0.8 μM, and 1.0 μM). Substrate concentration, buffer pH, temperature, and other conditions were held constant, and endpoint fluorescence intensity was monitored. If the predicted optimal primer concentration produced significantly higher fluorescence than the other groups, the dry-lab prediction was considered validated; if another concentration yielded a stronger fluorescence response, the dry-lab model would require further optimization to incorporate additional experimental factors. Reactions were performed at 40 °C, the instrument was set to 50 cycles, and fluorescence signals were collected in real time. Detailed formulation parameters are provided in Table 8.
ii) Experimental Results:
The results showed that, among the tested final primer concentrations (0.3 μM, 0.4 μM, 0.5 μM, 0.6 μM, 0.8 μM, and 1.0 μM), the 0.4 μM group produced the strongest fluorescence response. Considering the suitable primer-concentration range identified by dry-lab simulation, 0.4 μM was selected as the optimal final primer concentration for subsequent iterative optimization. The results are shown in Figure 7.

e) Significance of the Dry-Lab/Wet-Lab Closed-Loop Iterative Cycle
Using a differential-evolution algorithm, the dry-lab workflow performed global coarse and local fine searches that substantially narrowed the effective optimization ranges for the key enzymes, proteins, and primers in the RPA-CRISPR system. This approach avoided the broad, blind screening required in conventional wet-lab optimization, allowing subsequent experiments to test only fine concentration gradients near the model-predicted optimum. It therefore reduced experimental cost and trial-and-error workload while enabling precise parameter screening and iterative condition optimization, ultimately identifying the reaction concentrations best suited to this detection system and establishing a closed-loop logic in which dry-lab predictions guide targeted wet-lab validation.
2.2.3 Systematic Optimization of the RPA-CRISPR Cascade Reaction System
a) Experimental Design
In addition to the reaction parameters described above, the detection performance of the RPA-CRISPR cascade reaction system is jointly affected by reaction temperature, final reporter concentration, the RNP ratio ( Cas12a:crRNA) and Mg2+ concentration. Therefore, we further used the RPA-CRISPR cascade-amplification detection system described in Section 2.1 and optimized each key reaction parameter using a one-factor-at-a-time approach. Reaction temperatures were set to 37, 39, 40, 41, and 42 °C; final reporter concentrations to 500, 750, 1000, 1500, and 2000 nM; RNP ratios to 3:1, 2:1, 1:1, 1:2, and 1:3; and Mg2+ concentrations were set to 5, 10, 15, 20, and 25 mM. The signal difference between positive samples and negative controls on the fluorescence amplification curves under different conditions was used as the evaluation metric to identify the reaction conditions that provided the best detection performance. Reactions were performed at 41 °C, the instrument was set to 50 cycles, and fluorescence signals were collected in real time. Detailed formulation parameters are provided in Table 3.
b) Experimental Results
i) Temperature:
As shown in Figure 8, the optimal reaction temperature for the RPA-CRISPR cascade reaction system was 41 °C. This indicates that 41 °C provides a suitable compromise between RPA amplification and Cas12a cleavage, enabling optimal fluorescence-signal output.

ii) Mg2+ Concentration:
As shown in Figure 9, the optimal Mg2+ concentration for the RPA-CRISPR cascade reaction system was 20 mM. As a key enzymatic cofactor, a concentration of 20 mM can balance amplification and cleavage activities; deviation from this level instead suppresses overall reaction performance.

iii) Probe Concentration:
As shown in Figure 10, the optimal probe concentration for the RPA-CRISPR cascade reaction system was 2000 nM. At 2000 nM, the probe concentration provides sufficient cleavage substrate for a strong signal while avoiding increased background caused by excessive probe.

iv) RNP Ratio (Cas12a:gRNA):
As shown in Figure 11, the optimal RNP ratio for the RPA-CRISPR cascade reaction system was 3:1. This result indicates that, relative to gRNA, a moderately higher proportion of Cas12a promotes efficient assembly of functional RNP complexes and enhances nuclease cleavage efficiency after target activation.

2.2.4 Iteration and Bias Correction of the Dry-Lab Model Based on Wet-Lab Validation
Based on experimental validation of the candidate primer-crRNA screening results and optimized parameters described above, wet-lab data were fed back into the simulation model. Parameter updates and iterative correction were then used to continuously reduce discrepancies between model predictions and experimental results, forming a closed-loop process of "model prediction - experimental validation - data feedback - model optimization." Through this continuous cycle, the predictive accuracy, stability, and reliability of the model for the RPA-CRISPR reaction system were progressively improved, providing more accurate theoretical guidance for subsequent experimental design and parameter optimization.
3 Performance Evaluation of the Detection System
3.1 Sensitivity Evaluation
3.1.1 Experimental Design
Detection sensitivity was evaluated by serial dilution of a model plasmid carrying the RSV N gene. The initial copy number of the positive plasmid was 1.307×10⁸ copies/μL. Following 10-fold serial dilution, six template concentrations were prepared, ranging from 1.307×100-1.307×10⁵ copies/μL, yielding a total of six template concentration levels. Detection capability at low copy numbers was evaluated by comparing fluorescence curves, endpoint fluorescence values, and positive/negative calls across the different concentrations. The lowest template concentration that consistently distinguished positive samples from negative controls was used as the sensitivity criterion. Sensitivity was evaluated using the optimized protocol for the combined RPA-CRISPR/Cas12a detection system.
Table 9 Preparation parameters for performance evaluation of the RPA-CRISPR/Cas12a cascade-amplification detection system
| Module | Component | Volume Added (μL) |
|---|---|---|
| RNP Reaction Mixture | gRNA(crRNA) | 0.39 |
| Cas12a protein | 1.17 | |
| NE Buffer | 1.95 | |
| DEPC water | 0.65 | |
| RNP premix | Total volume: 4.16 μL; pre-incubate at 37 °C for 30 min | |
| RPA Premix | F forward primer | 4.39 |
| R reverse primer | 4.39 | |
| Nuclease-free water | 23.22 | |
| RPA premix | Total volume: 32 μL; aliquot into 4 tubes, adding 7 μL to the bottom of each tube | |
| Final CRISPR Detection Mixture | RNP | 0.16 |
| ssDNA reporter | 0.3 | |
| Mg2+(MgSO4) | 3.75 | |
| ddH2O | 0.93 | |
| CRISPR premix | Total volume: 5.14 μL | |
| Positive control | Plasmid template | 2.86 |
| Negative control | Nuclease-free water | 2.86 |
| Total Volume per Reaction Tube | Total volume per tube: 15 μL (7 μL RPA at the bottom of the tube, 5.14 μL CRISPR onto the inner wall, and 2.86 μL plasmid/water) | |
Note: the recombinase, polymerase, single-stranded DNA-binding protein, and reverse transcriptase required for the experiment are all contained in the lyophilized reagent pellet
3.1.2 Experimental Results
In the RPA-CRISPR cascade reaction system, the sensitivity for the model plasmid carrying the RSV N gene was 1.307×10² copies/μL, indicating that a target nucleic-acid concentration of 130.7 copies per microliter, was sufficient for successful detection of a positive signal. The results are shown in Figure 12.

3.2 Specificity Evaluation
3.2.1 Experimental Design
Three model plasmids carrying the human metapneumovirus subtype B N gene, the SARS-CoV-2 N gene, and the influenza A virus HA gene, respectively, were selected for specificity validation, to evaluate the recognition specificity of the detection system. Specificity was defined as generation of a clear positive fluorescence signal only for the target model plasmid, while all non-target model plasmids were required to remain negative. All specificity tests were performed using the fully optimized RPA-CRISPR/Cas12a detection workflow. Reactions were conducted at 41 °C, the instrument was set to 50 cycles, and fluorescence signals were collected in real time. Detailed formulation parameters are provided in Table 9.
3.2.2 Experimental Results
Specificity validation showed that the complete RPA-CRISPR/Cas12a detection system generated a positive fluorescence signal only for the target model plasmid. None of the tested non-target plasmids showed an obvious increase in fluorescence, and their signal levels remained essentially consistent with the negative control. These results demonstrate that the parameter-optimized detection system has excellent recognition specificity and can effectively distinguish the target pathogen from non-target pathogens, meeting the specificity requirements for practical sample testing. The results are shown in Figure 13.

3.3 Reproducibility Evaluation
3.3.1 Experimental Design
Reproducibility was evaluated in six parallel experiments performed by two operators at different time points over two days. Reproducibility was considered acceptable when variation among repeated fluorescence-signal measurements remained within a reasonable range. The optimized RPA-CRISPR/Cas12a combined detection protocol was used for the evaluation. Reactions were performed at 41 °C, the instrument was set to 50 cycles, and fluorescence signals were collected in real time. Detailed formulation parameters are provided in Table 9.
3.3.2 Experimental Results
Two operators performed parallel experiments at different time points. The individual plots in Figure 14 show six independent fluorescence-kinetic curves generated by the two operators on different dates and at different times. The positive-sample curves exhibited highly similar rising trends, with only minor variation among experimental groups, while all negative controls remained at baseline throughout with no appreciable fluorescence increase. The six positive datasets were then combined to generate the overlaid curves shown in Figure 15. The strong overlap among the positive kinetic curves provides a direct indication of assay stability. The endpoint fluorescence signals at 25 min were then averaged across the six experiments, yielding a mean of 29688.90. The standard deviation was 1534.98, giving a coefficient of variation (CV) of approximately 5.17%.
The visual agreement observed in the individual and overlaid plots, together with the quantitative CV analysis, demonstrates that the RPA-CRISPR/Cas12a detection system has good inter-operator and inter-batch reproducibility.


3.4 Matrix-Interference Resistance Evaluation
3.4.1 Experimental Design
To simulate testing of real throat-swab clinical samples, we evaluated resistance to matrix interference. Actual throat-swab specimens contain salivary components, and sample pretreatment additionally requires lysis buffer to disrupt pathogens. Both matrix components may interfere with the RPA-CRISPR/Cas12a reaction, making it necessary to verify assay performance under saliva-lysis-buffer conditions. In this study, the target plasmid was diluted in an aqueous saliva/lysis-buffer mixture to simulate practical throat-swab testing conditions. A dilution series was prepared at plasmid concentrations near the limit of detection, and interference resistance was assessed by determining whether the system could reliably distinguish positive samples from negative controls in this complex matrix. The evaluation used the fully optimized combined RPA-CRISPR/Cas12a detection system; detailed reaction parameters are provided in Table 9.
3.4.2 Experimental Results
The matrix-interference study showed that the overall fluorescence-growth trends of the saliva-lysis-buffer matrix group and the pure-water control group were similar, with only small differences in positive-sample fluorescence and a slightly lower positive signal in the saliva-containing group. Even in the presence of the complex saliva-lysis-buffer matrix, the RPA-CRISPR/Cas12a detection system consistently identified the target model plasmid and clearly distinguished positive samples from negative controls; all negative controls remained at a stable baseline without nonspecific fluorescence increases. These results demonstrate that the optimized system has good resistance to matrix interference. Complex salivary components and lysis buffer produced only slight inhibition and did not substantially compromise detection performance, supporting its applicability to subsequent testing of real clinical saliva samples. The results are shown in Figure 16.

Positive and negative controls were tested both with and without a saliva-containing matrix.
3.5 Comparison with qPCR (Standard Detection Method)
3.5.1 Experimental Design
Ten clinical nucleic-acid extracts provided by the CDC were used for sample validation, comprising five case samples and five healthy-control samples. All nucleic-acid samples had been rendered non-infectious; this project used only nucleic-acid samples determined by the CDC to pose no biosafety risk. The national-standard qPCR method was used as the gold standard for quantitative testing, and the same samples were tested in parallel using the RPA-CRISPR detection system developed in this study. The RPA-CRISPR results were compared with the qPCR gold-standard results to evaluate the practical detection capability and performance of the system in real clinical nucleic-acid samples.
3.5.2 Experimental Results
The results are shown in Table 10. Samples 1-5 were case samples and Samples 6-10 were healthy-control samples. Using the national-standard qPCR result as the gold-standard reference, the RPA-CRISPR/Cas12a detection system identified all five case samples as positive and all five healthy-control samples as negative, in complete agreement with the qPCR calls. For nucleic-acid samples of genuine clinical origin, the system accurately distinguished positive cases from healthy controls. These results demonstrate that the optimized RPA-CRISPR/Cas12a system provides reliable sample-detection performance and excellent diagnostic concordance with the qPCR gold standard, supporting subsequent point-of-care rapid-testing applications.
Table 10 Comparison of RSV Clinical Nucleic-Acid Sample Results Obtained by qPCR and the RPA-CRISPR/Cas12a System
| Sample Name | qPCR | RPA-CRISPR/Cas12a |
|---|---|---|
| Sample 1 | Positive | Positive |
| Sample 2 | Positive | Positive |
| Sample 3 | Positive | Positive |
| Sample 4 | Positive | Positive |
| Sample 5 | Positive | Positive |
| Sample 6 | Negative | Negative |
| Sample 7 | Negative | Negative |
| Sample 8 | Negative | Negative |
| Sample 9 | Negative | Negative |
| Sample 10 | Negative | Negative |
4 Transfer to Human Metapneumovirus Subtype B (hMPV-B) N gene and Performance Characterization
4.1 Dry-Lab Model Optimization Output
4.1.1 Optimal Primer-Set Sequences
Forward primer: 5′-TTATGACTTGGTGAGAGAAATGGGTCCTGA-3′
Reverse primer: 5′-CCAAGAACAACACTAGCAAAATTGGGGCAA-3′
crRNA:5′-UAAUUUCUACUAAGUGUAGAUCAUCUAAGACAAAGUCCAAAGGC-3′
4.1.2 Optimal Parameters
Same as the optimized parameters for respiratory syncytial virus.
4.2 Performance Evaluation
4.2.1 Sensitivity Evaluation
a) Experimental Design
The experimental procedure was generally the same as that used for RSV sensitivity evaluation, except for differences in system settings. For details, click the link to the protocol section.
b) Experimental Results
In the RPA-CRISPR cascade reaction system, the sensitivity for the model plasmid carrying the hMPV-B N gene was 1.43×101 copies/μL, indicating that the target nucleic-acid concentration in the sample only needed to reach 14.3 copies, to generate a detectable positive signal. The results are shown in Figure 17.

4.2.2 Specificity Evaluation
a) Experimental Design
The experimental procedure was generally the same as that used for RSV specificity evaluation, except for differences in system settings. For details, click the link to the protocol section.
b) Experimental Results
Specificity validation showed that the complete RPA-CRISPR/Cas12a detection system generated a positive fluorescence signal only for the model plasmid carrying the hMPV-B N gene. No obvious fluorescence increase was observed for any model plasmid carrying a tested non-target pathogen target-region genes, and signal levels remained essentially consistent with the negative control. These results indicate that the parameter-optimized detection system has excellent recognition specificity and can effectively distinguish the target pathogen from other non-target pathogens, meeting the specificity requirements for practical sample testing. The results are shown in Figure 18.

4.2.3 Reproducibility Evaluation
a) Experimental Design
The experimental procedure was generally the same as that used for RSV reproducibility evaluation, except for differences in system settings. For details, click the link to the protocol section.
b) Experimental Results
Two operators performed parallel experiments at different time points. The individual plots in Figure 19 show six independent fluorescence-kinetic curves obtained by the two operators on different dates and at different times. The positive-sample curves exhibited highly similar rising trends; the negative controls remained at baseline throughout with no obvious fluorescence increase, and only minor variation was observed among experimental batches. The six positive datasets were combined to generate the overlaid curves shown in Figure 20. The strong overlap among the positive kinetic curves directly reflects the stability of the system. The endpoint fluorescence signals at 25 min were then averaged across the six experiments, yielding a mean of 1.09×10⁷, after which the standard deviation of the six measurements was calculated as 7.44×10⁵. Dividing the standard deviation by the mean yielded an endpoint-signal coefficient of variation (CV) of approximately 6.83%.
The visual agreement in the individual and overlaid plots, together with the quantitative CV analysis, demonstrates that the RPA-CRISPR/Cas12a detection system has good inter-operator and inter-batch reproducibility for the model plasmid carrying the hMPV-B N gene.


4.2.4 Matrix-Interference Resistance Evaluation
a) Experimental Design
The experimental procedure was generally the same as that used for RSV matrix-interference resistance evaluation, except for differences in system settings. For details, click the link to the protocol section.
b) Experimental Results
The matrix-interference study showed that the overall fluorescence-growth trends of the saliva-lysis-buffer matrix group and the pure-water control group were similar, with only small differences in positive-sample fluorescence and a slightly lower positive signal in the saliva-containing group. Even in the presence of the complex saliva-lysis-buffer matrix, the RPA-CRISPR/Cas12a detection system consistently identified the model plasmid carrying the hMPV-B N gene and clearly distinguished positive samples from negative controls; all negative controls remained at a stable baseline without nonspecific fluorescence increases. These results demonstrate that the optimized system has good resistance to matrix interference. Complex salivary components and lysis buffer produced only slight inhibition and did not substantially compromise detection performance, supporting its applicability to subsequent testing of real clinical saliva samples.

4.2.5 Comparison with the qPCR Method
a) Experimental Design
Ten clinical nucleic-acid extracts provided by the CDC were used for sample validation, comprising five case samples and five healthy-control samples. All nucleic-acid samples had been rendered non-infectious; this project used only nucleic-acid samples determined by the CDC to pose no biosafety risk. The national-standard qPCR method was used as the gold standard for quantitative testing, and the same samples were tested in parallel using the RPA-CRISPR detection system developed in this study. The RPA-CRISPR results were compared with the qPCR gold-standard results to evaluate the practical detection capability and performance of the system in real clinical nucleic-acid samples.
b) Experimental Results
The results are shown in Table 11. Samples 1-5 were case samples and Samples 6-10 were healthy-control samples. Using the national-standard qPCR result as the gold-standard reference, the RPA-CRISPR/Cas12a detection system identified all five case samples as positive and all five healthy-control samples as negative, in complete agreement with the qPCR calls. For nucleic-acid samples of genuine clinical origin, the system accurately distinguished positive cases from healthy controls. These results demonstrate that the optimized RPA-CRISPR/Cas12a system provides reliable sample-detection performance and excellent diagnostic concordance with the qPCR gold standard, supporting subsequent point-of-care rapid-testing applications.
Table 11 Comparison of hMPV-B Clinical Nucleic-Acid Sample Results Obtained by qPCR and the RPA-CRISPR/Cas12a System
| Sample Name | qPCR | RPA-CRISPR/Cas12a |
|---|---|---|
| Sample 1 | Positive | Positive |
| Sample 2 | Positive | Positive |
| Sample 3 | Positive | Positive |
| Sample 4 | Positive | Positive |
| Sample 5 | Positive | Positive |
| Sample 6 | Negative | Negative |
| Sample 7 | Negative | Negative |
| Sample 8 | Negative | Negative |
| Sample 9 | Negative | Negative |
| Sample 10 | Negative | Negative |
5 Transfer to Streptococcus pneumoniae-lytA (SPN-lytA) and Performance Characterization
5.1 Dry-Lab Model Optimization Output
5.1.1 Optimal Primer-crRNA Combination Sequences
Forward primer:5′- GGGCATTAGCCGTGAGCAGTTTAAG -3′
Reverse primer: 5′-AGCCTGTAGCCATTTCGCCTGAGTTG-3′
crRNA:5′-UAAUUUCUACUAAGUGUAGAUACAGUUCAGGCUAUAUGCUU-3′
5.1.2 Optimal Parameters
Same as the optimized parameters for respiratory syncytial virus.
5.2 Performance Evaluation
5.2.1 Sensitivity Evaluation
a) Experimental Design
The experimental procedure was generally the same as that used for RSV sensitivity evaluation, except for differences in system settings. For details, click the link to the protocol section.
b) Experimental Results
In the RPA-CRISPR cascade reaction system, the sensitivity for the model plasmid carrying SPN-lytA was 1.0×10² copies/μL, indicating that the target nucleic-acid concentration in the sample only needed to reach 100 copies, to generate a detectable positive signal. The results are shown in Figure 22.

5.2.2 Specificity Evaluation
a) Experimental Design
The experimental procedure was generally the same as that used for RSV specificity evaluation, except for differences in system settings. For details, click the link to the protocol section.
b) Experimental Results
Specificity validation showed that the complete RPA-CRISPR/Cas12a detection system generated a positive fluorescence signal only for the model plasmid carrying SPN-lytA. No obvious fluorescence increase was observed for any model plasmid carrying a tested non-target pathogen target-region genes, and signal levels remained essentially consistent with the negative control. These results indicate that the parameter-optimized detection system has excellent recognition specificity and can effectively distinguish the target pathogen from other non-target pathogens, meeting the specificity requirements for practical sample testing. The results are shown in Figure 23.

5.2.3 Reproducibility Evaluation
a) Experimental Design
The experimental procedure was generally the same as that used for RSV reproducibility evaluation, except for differences in system settings. For details, click the link to the protocol section.
b) Experimental Results
Two operators performed parallel experiments at different time points. The individual plots in Figure 24 show six independent fluorescence-kinetic curves obtained by the two operators on different dates and at different times. The positive-sample curves exhibited highly similar rising trends; the negative controls remained at baseline throughout with no obvious fluorescence increase, and only minor variation was observed among experimental batches. The six positive datasets were combined to generate the overlaid curves shown in Figure 25. The strong overlap among the positive kinetic curves directly reflects the stability of the system. The endpoint fluorescence signals at 25 min were then averaged across the six experiments, yielding a mean of 24711.87. The standard deviation was 1837.92, giving an endpoint-signal coefficient of variation (CV) of approximately 7.44%.
The visual agreement in the individual and overlaid plots, together with the quantitative CV analysis, demonstrates that the RPA-CRISPR/Cas12a detection system has good inter-operator and inter-batch reproducibility for the model plasmid carrying SPN-lytA.


5.2.4 Matrix-Interference Resistance Evaluation
a) Experimental Design
The experimental procedure was generally the same as that used for RSV matrix-interference resistance evaluation, except for differences in system settings. For details, click the link to the protocol section.
b) Experimental Results
The matrix-interference study showed that the overall fluorescence-growth trends of the saliva-lysis-buffer matrix group and the pure-water control group were similar, with only small differences in positive-sample fluorescence. Even in the presence of the complex saliva-lysis-buffer matrix, the RPA-CRISPR/Cas12a detection system consistently identified the model plasmid carrying SPN-lytA and clearly distinguished positive samples from negative controls; all negative controls remained at a stable baseline without nonspecific fluorescence increases. These results demonstrate that the optimized system has good resistance to matrix interference. Complex salivary components and lysis buffer produced only slight inhibition and did not substantially compromise detection performance, supporting its applicability to subsequent testing of real clinical saliva samples.

5.2.5 Comparison with the qPCR Method
a) Experimental Design
Ten clinical nucleic-acid extracts provided by the CDC were used for sample validation, comprising five case samples and five healthy-control samples. All nucleic-acid samples had been rendered non-infectious; this project used only nucleic-acid samples determined by the CDC to pose no biosafety risk. The national-standard qPCR method was used as the gold standard for quantitative testing, and the same samples were tested in parallel using the RPA-CRISPR detection system developed in this study. The RPA-CRISPR results were compared with the qPCR gold-standard results to evaluate the practical detection capability and performance of the system in real clinical nucleic-acid samples.
b) Experimental Results
The results are shown in Table 12. Samples 1-5 were case samples and Samples 6-10 were healthy-control samples. Using the national-standard qPCR result as the gold-standard reference, the RPA-CRISPR/Cas12a detection system identified all five case samples as positive and all five healthy-control samples as negative, in complete agreement with the qPCR calls. For nucleic-acid samples of genuine clinical origin, the system accurately distinguished positive cases from healthy controls. These results demonstrate that the optimized RPA-CRISPR/Cas12a system provides reliable sample-detection performance and excellent diagnostic concordance with the qPCR gold standard, supporting subsequent point-of-care rapid-testing applications.
Table 12 Comparison of SPN Clinical Nucleic-Acid Sample Results Obtained by qPCR and the RPA-CRISPR/Cas12a System
| Sample Name | qPCR | RPA-CRISPR/Cas12a |
|---|---|---|
| Sample 1 | Positive | Positive |
| Sample 2 | Positive | Positive |
| Sample 3 | Positive | Positive |
| Sample 4 | Positive | Positive |
| Sample 5 | Positive | Positive |
| Sample 6 | Negative | Negative |
| Sample 7 | Negative | Negative |
| Sample 8 | Negative | Negative |
| Sample 9 | Negative | Negative |
| Sample 10 | Negative | Negative |
6 Transfer to Bordetella pertussis-IS1663 (BP-IS1663) and Performance Characterization
6.1 Dry-Lab Model Optimization Output
6.1.1 Optimal Primer-crRNA Combination Sequences
Forward primer: 5′-TCCTGGAGCCTACGGGTCTGTATCAC-3′
Reverse primer: 5′-CGTAGCTGTCGAGCGCATCATTTTTGGAG-3′
crRNA: 5′-UAAUUUCUACUAAGUGUAGAUGUCAAUCCCGCCCAGGCCCG-3′
6.1.2 Optimal Parameters
Same as the optimized parameters for respiratory syncytial virus.
6.2 Performance Evaluation
6.2.1 Sensitivity Evaluation
a) Experimental Design
The experimental procedure was generally the same as that used for RSV sensitivity evaluation, except for differences in system settings. For details, click the link to the protocol section.
b) Experimental Results
In the RPA-CRISPR cascade reaction system, the sensitivity for the model plasmid carrying BP-IS1663 was 1.0×101 copies/μL, indicating that the target nucleic-acid concentration in the sample only needed to reach 10 copies, to generate a detectable positive signal. The results are shown in Figure 27.

6.2.2 Specificity Evaluation
a) Experimental Design
The experimental procedure was generally the same as that used for RSV specificity evaluation, except for differences in system settings. For details, click the link to the protocol section.
b) Experimental Results
Specificity validation showed that the complete RPA-CRISPR/Cas12a detection system generated a positive fluorescence signal only for the model plasmid carrying BP-IS1663. No obvious fluorescence increase was observed for any model plasmid carrying a tested non-target pathogen target-region genes, and signal levels remained essentially consistent with the negative control. These results indicate that the parameter-optimized detection system has excellent recognition specificity and can effectively distinguish the target pathogen from other non-target pathogens, meeting the specificity requirements for practical sample testing. The results are shown in Figure 28.

6.2.3 Reproducibility Evaluation
a) Experimental Design
The experimental procedure was generally the same as that used for RSV reproducibility evaluation, except for differences in system settings. For details, click the link to the protocol section.
b) Experimental Results
Two operators performed parallel experiments at different time points. The individual plots in Figure 29 show six independent fluorescence-kinetic curves obtained by the two operators on different dates and at different times. The positive-sample curves exhibited highly similar rising trends; the negative controls remained at baseline throughout with no obvious fluorescence increase, and only minor variation was observed among experimental batches. The six positive datasets were combined to generate the overlaid curves shown in Figure 30. The strong overlap among the positive kinetic curves directly reflects the stability of the system. The endpoint fluorescence signals at 25 min were then averaged across the six experiments, yielding a mean of 42439.09. The standard deviation was 5546.89, giving an endpoint-signal coefficient of variation (CV) of approximately 13.07%.
The visual agreement in the individual and overlaid plots, together with the quantitative CV analysis, demonstrates that the RPA-CRISPR/Cas12a detection system has workable inter-operator and inter-batch reproducibility for the model plasmid carrying BP-IS1663.


6.2.4 Matrix-Interference Resistance Evaluation
a) Experimental Design
The experimental procedure was generally the same as that used for RSV matrix-interference resistance evaluation, except for differences in system settings. For details, click the link to the protocol section.
b) Experimental Results
The matrix-interference study showed that the overall fluorescence-growth trends of the saliva-lysis-buffer matrix group and the pure-water control group were similar, with only small differences in positive-sample fluorescence. Even in the presence of the complex saliva-lysis-buffer matrix, the RPA-CRISPR/Cas12a detection system consistently identified the model plasmid carrying BP-IS1663 and clearly distinguished positive samples from negative controls; all negative controls remained at a stable baseline without nonspecific fluorescence increases. These results demonstrate that the optimized system has good resistance to matrix interference. Complex salivary components and lysis buffer produced only slight inhibition and did not substantially compromise detection performance, supporting its applicability to subsequent testing of real clinical saliva samples.

6.2.5 Comparison with the qPCR Method
a) Experimental Design
Ten clinical nucleic-acid extracts provided by the CDC were used for sample validation, comprising five case samples and five healthy-control samples. All nucleic-acid samples had been rendered non-infectious; this project used only nucleic-acid samples determined by the CDC to pose no biosafety risk. The national-standard qPCR method was used as the gold standard for quantitative testing, and the same samples were tested in parallel using the RPA-CRISPR detection system developed in this study. The RPA-CRISPR results were compared with the qPCR gold-standard results to evaluate the practical detection capability and performance of the system in real clinical nucleic-acid samples.
b) Experimental Results
The results are shown in Table 13. Samples 1-5 were case samples and Samples 6-10 were healthy-control samples. Using the national-standard qPCR result as the gold-standard reference, the RPA-CRISPR/Cas12a detection system identified all five case samples as positive and all five healthy-control samples as negative, in complete agreement with the qPCR calls. For nucleic-acid samples of genuine clinical origin, the system accurately distinguished positive cases from healthy controls. These results demonstrate that the optimized RPA-CRISPR/Cas12a system provides reliable sample-detection performance and excellent diagnostic concordance with the qPCR gold standard, supporting subsequent point-of-care rapid-testing applications.
Table 13 Comparison of BP Clinical Nucleic-Acid Sample Results Obtained by qPCR and the RPA-CRISPR/Cas12a System
| Sample Name | qPCR | RPA-CRISPR/Cas12a |
|---|---|---|
| Sample 1 | Positive | Positive |
| Sample 2 | Positive | Positive |
| Sample 3 | Positive | Positive |
| Sample 4 | Positive | Positive |
| Sample 5 | Positive | Positive |
| Sample 6 | Negative | Negative |
| Sample 7 | Negative | Negative |
| Sample 8 | Negative | Negative |
| Sample 9 | Negative | Negative |
| Sample 10 | Negative | Negative |
7 Transfer to Haemophilus influenzae-ompP6 (HI-ompP6) and Performance Characterization
7.1 Dry-Lab Model Optimization Output
7.1.1 Optimal Primer-Set Sequences
Forward primer: 5′-TGGCCTAATGCGATGTTGTATTCTGG-3′
Reverse primer:5′- TGGCGGTTACTCTGTTGCTGATCTT-3′
crRNA: 5′-UAAUUUCUACUAAGUGUAGAUAACGUAUUCACCAGUAAU-3′
7.1.2 Optimal Parameters
Same as the optimized parameters for respiratory syncytial virus.
7.2 Performance Evaluation
7.2.1 Sensitivity Evaluation
a) Experimental Design
The experimental procedure was generally the same as that used for RSV sensitivity evaluation, except for differences in system settings. For details, click the link to the protocol section.
b) Experimental Results
In the RPA-CRISPR cascade reaction system, the sensitivity for the model plasmid carrying the HI-ompP6 gene was 1.0×10³ copies/μL, indicating that the target nucleic-acid concentration in the sample only needed to reach 1000 copies, to generate a detectable positive signal. The results are shown in Figure 32.

7.2.2 Specificity Evaluation
a) Experimental Design
The experimental procedure was generally the same as that used for RSV specificity evaluation, except for differences in system settings. For details, click the link to the protocol section.
b) Experimental Results
Specificity validation showed that the complete RPA-CRISPR/Cas12a detection system generated a positive fluorescence signal only for the model plasmid carrying the HI-ompP6 gene. No obvious fluorescence increase was observed for any model plasmid carrying a tested non-target pathogen target-region genes, and signal levels remained essentially consistent with the negative control. These results indicate that the parameter-optimized detection system has excellent recognition specificity and can effectively distinguish the target pathogen from other non-target pathogens, meeting the specificity requirements for practical sample testing. The results are shown in Figure 33.

7.2.3 Reproducibility Evaluation
a) Experimental Design
The experimental procedure was generally the same as that used for RSV reproducibility evaluation, except for differences in system settings. For details, click the link to the protocol section.
b) Experimental Results
Two operators performed parallel experiments at different time points. The individual plots in Figure 34 show six independent fluorescence-kinetic curves obtained by the two operators on different dates and at different times. The positive-sample curves exhibited highly similar rising trends; the negative controls remained at baseline throughout with no obvious fluorescence increase, and only minor variation was observed among experimental batches. The six positive datasets were combined to generate the overlaid curves shown in Figure 35. The strong overlap among the positive kinetic curves directly reflects the stability of the system. The endpoint fluorescence signals at 25 min were then averaged across the six experiments, yielding a mean of 12275.88. The standard deviation was 2548.85, giving an endpoint-signal coefficient of variation (CV) of approximately 20.76%.
The visual comparison of individual and overlaid plots, along with quantitative CV analysis, indicates that the reproducibility of the RPA-CRISPR/Cas12a detection system for the model plasmid carrying the HI-ompP6 gene is suboptimal. This may be attributed to variations in operator technique, reagent performance, and other experimental factors. Further tests on inter-batch and inter-operator reproducibility will be performed, and corresponding optimizations to the reaction system will be implemented if necessary.


7.2.4 Matrix-Interference Resistance Evaluation
a) Experimental Design
The experimental procedure was generally the same as that used for RSV matrix-interference resistance evaluation, except for differences in system settings. For details, click the link to the protocol section.
b) Experimental Results
The matrix-interference study showed that the overall fluorescence-growth trends of the saliva-lysis-buffer matrix group and the pure-water control group were similar, with only small differences in positive-sample fluorescence. Even in the presence of the complex saliva-lysis-buffer matrix, the RPA-CRISPR/Cas12a detection system consistently identified the model plasmid carrying the HI-ompP6 gene and clearly distinguished positive samples from negative controls; all negative controls remained at a stable baseline without nonspecific fluorescence increases. These results demonstrate that the optimized system has good resistance to matrix interference. Complex salivary components and lysis buffer produced only slight inhibition and did not substantially compromise detection performance, supporting its applicability to subsequent testing of real clinical saliva samples.

7.2.5 Comparison with the qPCR Method
a) Experimental Design
Ten clinical nucleic-acid extracts provided by the CDC were used for sample validation, comprising five case samples and five healthy-control samples. All nucleic-acid samples had been rendered non-infectious; this project used only nucleic-acid samples determined by the CDC to pose no biosafety risk. The national-standard qPCR method was used as the gold standard for quantitative testing, and the same samples were tested in parallel using the RPA-CRISPR detection system developed in this study. The RPA-CRISPR results were compared with the qPCR gold-standard results to evaluate the practical detection capability and performance of the system in real clinical nucleic-acid samples.
b) Experimental Results
The results are shown in Table 14. Samples 1-5 were case samples and Samples 6-10 were healthy-control samples. Using the national-standard qPCR result as the gold-standard reference, the RPA-CRISPR/Cas12a detection system identified all five case samples as positive and all five healthy-control samples as negative, in complete agreement with the qPCR calls. For nucleic-acid samples of genuine clinical origin, the system accurately distinguished positive cases from healthy controls. These results demonstrate that the optimized RPA-CRISPR/Cas12a system provides reliable sample-detection performance and excellent diagnostic concordance with the qPCR gold standard, supporting subsequent point-of-care rapid-testing applications.
Table 14 Comparison of HI Clinical Nucleic-Acid Sample Results Obtained by qPCR and the RPA-CRISPR/Cas12a System
| Sample Name | qPCR | RPA-CRISPR/Cas12a |
|---|---|---|
| Sample 1 | Positive | Positive |
| Sample 2 | Positive | Positive |
| Sample 3 | Positive | Positive |
| Sample 4 | Positive | Positive |
| Sample 5 | Positive | Positive |
| Sample 6 | Negative | Negative |
| Sample 7 | Negative | Negative |
| Sample 8 | Negative | Negative |
| Sample 9 | Negative | Negative |
| Sample 10 | Negative | Negative |
8 Development of a Portable Detection Device and Validation of Multiplex Pathogen Detection
8.1 Design and Assembly of the Portable Instrument
The detection system developed in this study was implemented on our self-developed portable instrument. A schematic of the portable instrument is shown below:

For further details about the portable instrument, please go to the Hardware page
8.2 Simultaneous Multiplex-Pathogen Detection Using the Portable Instrument
The independently designed detection reagent system was integrated into our self-developed portable instrument. Instrument-based testing and validation successfully demonstrated simultaneous detection of multiple pathogens. The figure below shows the experimental results obtained using this reagent system on the portable instrument.
9 Application Potential
Our project established an integrated measurement-optimization paradigm combining DNABERT-based intelligent sequence screening, enzymatic kinetic modeling, and DBTL wet-lab closed-loop correction, to establish a standardized development workflow for the RPA-CRISPR/Cas12a fluorescence-based quantitative measurement system. By performing dry-lab sequence screening in advance, the workflow filters poorly compatible candidate sequences and those with potential off-target risks. This replaces extensive repetitive wet-lab trial-and-error screening, shortens the overall development process for primer screening and reaction-condition tuning, reduces costs associated with consumables and manual trial and error, and accelerates iterative refinement of the detection system. The measurement-optimization framework also exhibits strong transferability and is not limited to the respiratory pathogens investigated initially, such as respiratory syncytial virus. By substituting conserved target-gene sequences, the workflow can rapidly complete screening of RPA primer-crRNA combinations and preliminary reaction-parameter prediction for other pathogens.It can therefore serve as a general development paradigm for constructing rapid-detection methods for a broad range of pathogenic microorganisms.
When coupled with our self-developed portable fluorescence measurement device, the complete isothermal fluorescence-based quantitative measurement system can be deployed across diverse real-world testing scenarios. It enables accurate identification of low-copy samples early in infection, supports on-site screening by public-health personnel at clustered-outbreak locations to shorten response times to emerging infectious diseases, and supports routine pathogen-load monitoring among susceptible populations including children and older adults in settings such as kindergartens and nursing homes. The optimization workflow can be extended to animal husbandry for on-site detection of zoonotic pathogens in livestock and poultry. Overall, our approach integrates sequence-based dry-lab optimization, wet-lab closed-loop iteration, portable hardware, and multi-scenario deployment into a complete workflow. It addresses the long development cycles and high trial-and-error costs of conventional nucleic-acid diagnostics, as well as the poor suitability of large instruments for field measurements, and provides a reusable, standardized technical paradigm for fluorescence-based quantitative measurement of diverse pathogens. The approach has practical value for clinical pathogen diagnosis, emergency public-health response and routine population health monitoring.
Reference
GBD 2023 Lower Respiratory Infections and Antimicrobial Resistance Collaborators. Global burden of lower respiratory infections and aetiologies, 1990-2023: a systematic analysis for the Global Burden of Disease Study 2023. Lancet Infect Dis. 2026;26(4):343-361. doi:10.1016/S1473-3099(25)00689-9. PMID:41412141.
Lim J, Koprowski K, Stavins R, Xuan N, Hoang TH, Baek J, et al. Point-of-Care Multiplex Detection of Respiratory Viruses. ACS Sens. 2024;9(8):4058-4068. doi:10.1021/acssensors.4c00992. PMID:39101394.
Lin M, Qiu Z, Hao M, Qi W, Zhang T, Shen Y, et al. Cas12a Cis-cleavage mediated lateral flow assay enables multiplex and ultra-specific nucleic acid detection. Nat Commun. 2025;16(1):5597. doi:10.1038/s41467-025-60917-9. PMID:40593618.
Theel ES, Kirby JE, Pollock NR. Testing for SARS-CoV-2: lessons learned and current use cases. Clin Microbiol Rev. 2024;37(2). doi:10.1128/cmr.00072-23. PMID:38488364.
Yu ES, Jang H, Kwon JM, Jeong H, Park J, Kang BH, et al. Nanoplasmonic real-time RT-RPA and CRISPR/Cas12a detection for rapid point-of-care molecular diagnostics. Biosens Bioelectron. 2026;294:118216. doi:10.1016/j.bios.2025.118216. PMID:41242144.
Ahamed MA, Khalid MAU, Dong M, Politza AJ, Zhang Z, Kshirsagar A, et al. Sensitive and specific CRISPR-Cas12a assisted nanopore with RPA for Monkeypox detection. Biosens Bioelectron. 2024;246:115866. doi:10.1016/j.bios.2023.115866. PMID:38029710.
Hu F, Zhang Y, Yang Y, Peng L, Cui S, Ma Q, et al. A rapid and ultrasensitive RPA-assisted CRISPR-Cas12a/Cas13a nucleic acid diagnostic platform with a smartphone-based portable device. Biosens Bioelectron. 2025;280:117428. doi:10.1016/j.bios.2025.117428. PMID:40179699.
Chen Y, Wang X, Zhang J, Jiang Q, Qiao B, He B, et al. Split crRNA with CRISPR-Cas12a enabling highly sensitive and multiplexed detection of RNA and DNA. Nat Commun. 2024;15(1):8342. doi:10.1038/s41467-024-52691-x. PMID:39333528.
Nalefski EA, Kooistra RM, Parikh I, Hedley S, Rajaraman K, Madan D. Determinants of CRISPR Cas12a nuclease activation by DNA and RNA targets. Nucleic Acids Res. 2024;52(8):4502-4522. doi:10.1093/nar/gkae152. PMID:38477377.
Tian T, Xiao H, Guo X, Chen Y, Qiu Z, Zhang T, et al. Identification of a key nucleotide influencing Cas12a crRNA activity for universal photo-controlled CRISPR diagnostics. Nat Commun. 2025;16(1):6694. doi:10.1038/s41467-025-62082-5. PMID:40691444.
Cheng ZH, Luo XY, Yu SS, Min D, Zhang SX, Li XF, et al. Tunable control of Cas12 activity promotes universal and fast one-pot nucleic acid detection. Nat Commun. 2025;16(1):1166. doi:10.1038/s41467-025-56516-3. PMID:39885211.
Chen L, Hu M, Zhou X. Trends in developing one-pot CRISPR diagnostics strategies. Trends Biotechnol. 2025;43(1):98-110. doi:10.1016/j.tibtech.2024.07.007. PMID:39095257.
Huang Z, Song Z, Zeng J, Liu X, Fang M, Wu Z, et al. Sensitive pathogen DNA detection by a multi-guide RNA Cas12a assay favoring trans- versus cis-cleavage. Nat Commun. 2025;16(1):8257. doi:10.1038/s41467-025-63094-x. PMID:40962795.
Huang B, Guo L, Yin H, Wu Y, Zeng Z, Xu S, et al. Deep learning enhancing guide RNA design for CRISPR/Cas12a-based diagnostics. iMeta. 2024;3(4). doi:10.1002/imt2.214. PMID:39135699.
Dalla-Torre H, Gonzalez L, Mendoza-Revilla J, Lopez Carranza N, Grzywaczewski AH, Oteri F, et al. Nucleotide Transformer: building and evaluating robust foundation models for human genomics. Nat Methods. 2025;22(2):287-297. doi:10.1038/s41592-024-02523-z. PMID:39609566.
Khosla NK, Lesinski JM, Haywood-Alexander M, deMello AJ, Richards DA. Machine learning and statistical classification in CRISPR-Cas12a diagnostic assays. Biosens Bioelectron. 2025;279:117402. doi:10.1016/j.bios.2025.117402. PMID:40158491.
Rolando JC, Thieme A, Weckman NE, Kim N, de Puig H, Tan X, et al. Digital CRISPR-based diagnostics for quantification of Candida auris and resistance mutations. Nat Biomed Eng. 2026 Jan 14. doi:10.1038/s41551-025-01597-0. PMID:41535388.