
Overview
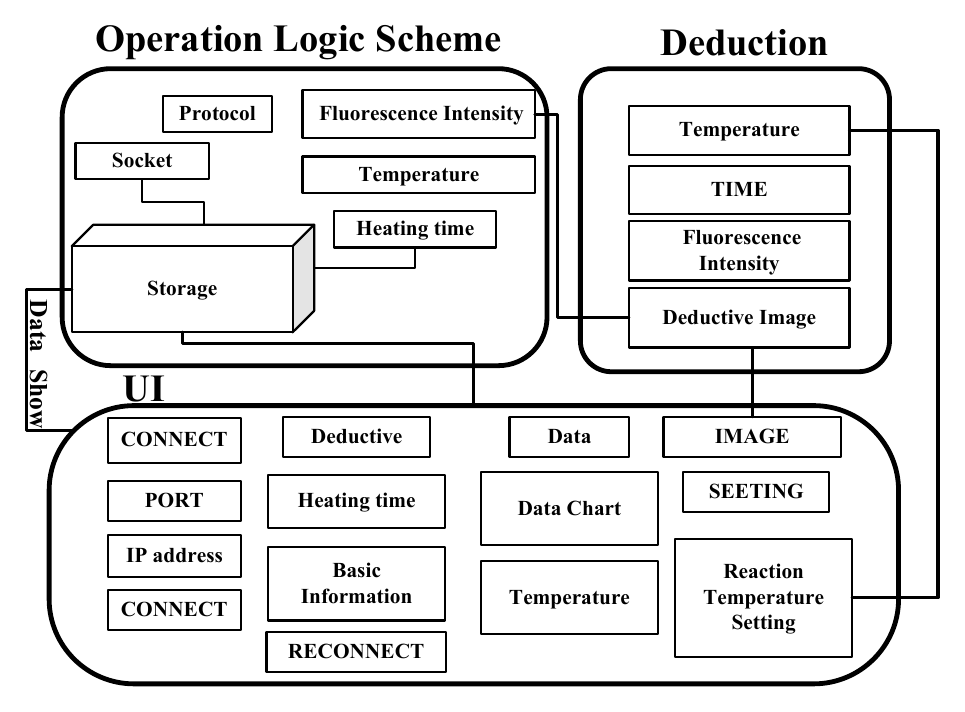
We developed an Android app that lets users operate the detector from a phone. It sends control commands over TCP and receives temperature readings, fluorescence data, images, and tube labels from the AI Box. Image processing runs on the AI Box; the app handles interaction, communication, and display.
Six core functions
Connect the device
Enter the AI Box IP address and port, establish the TCP connection, and reconnect when needed.
Configure a run
Set heating time and temperature controls. The second generation adds separate control switches and servo commands.
Monitor the reaction
Follow the heating countdown and temperature returned by the device.
Visualize fluorescence
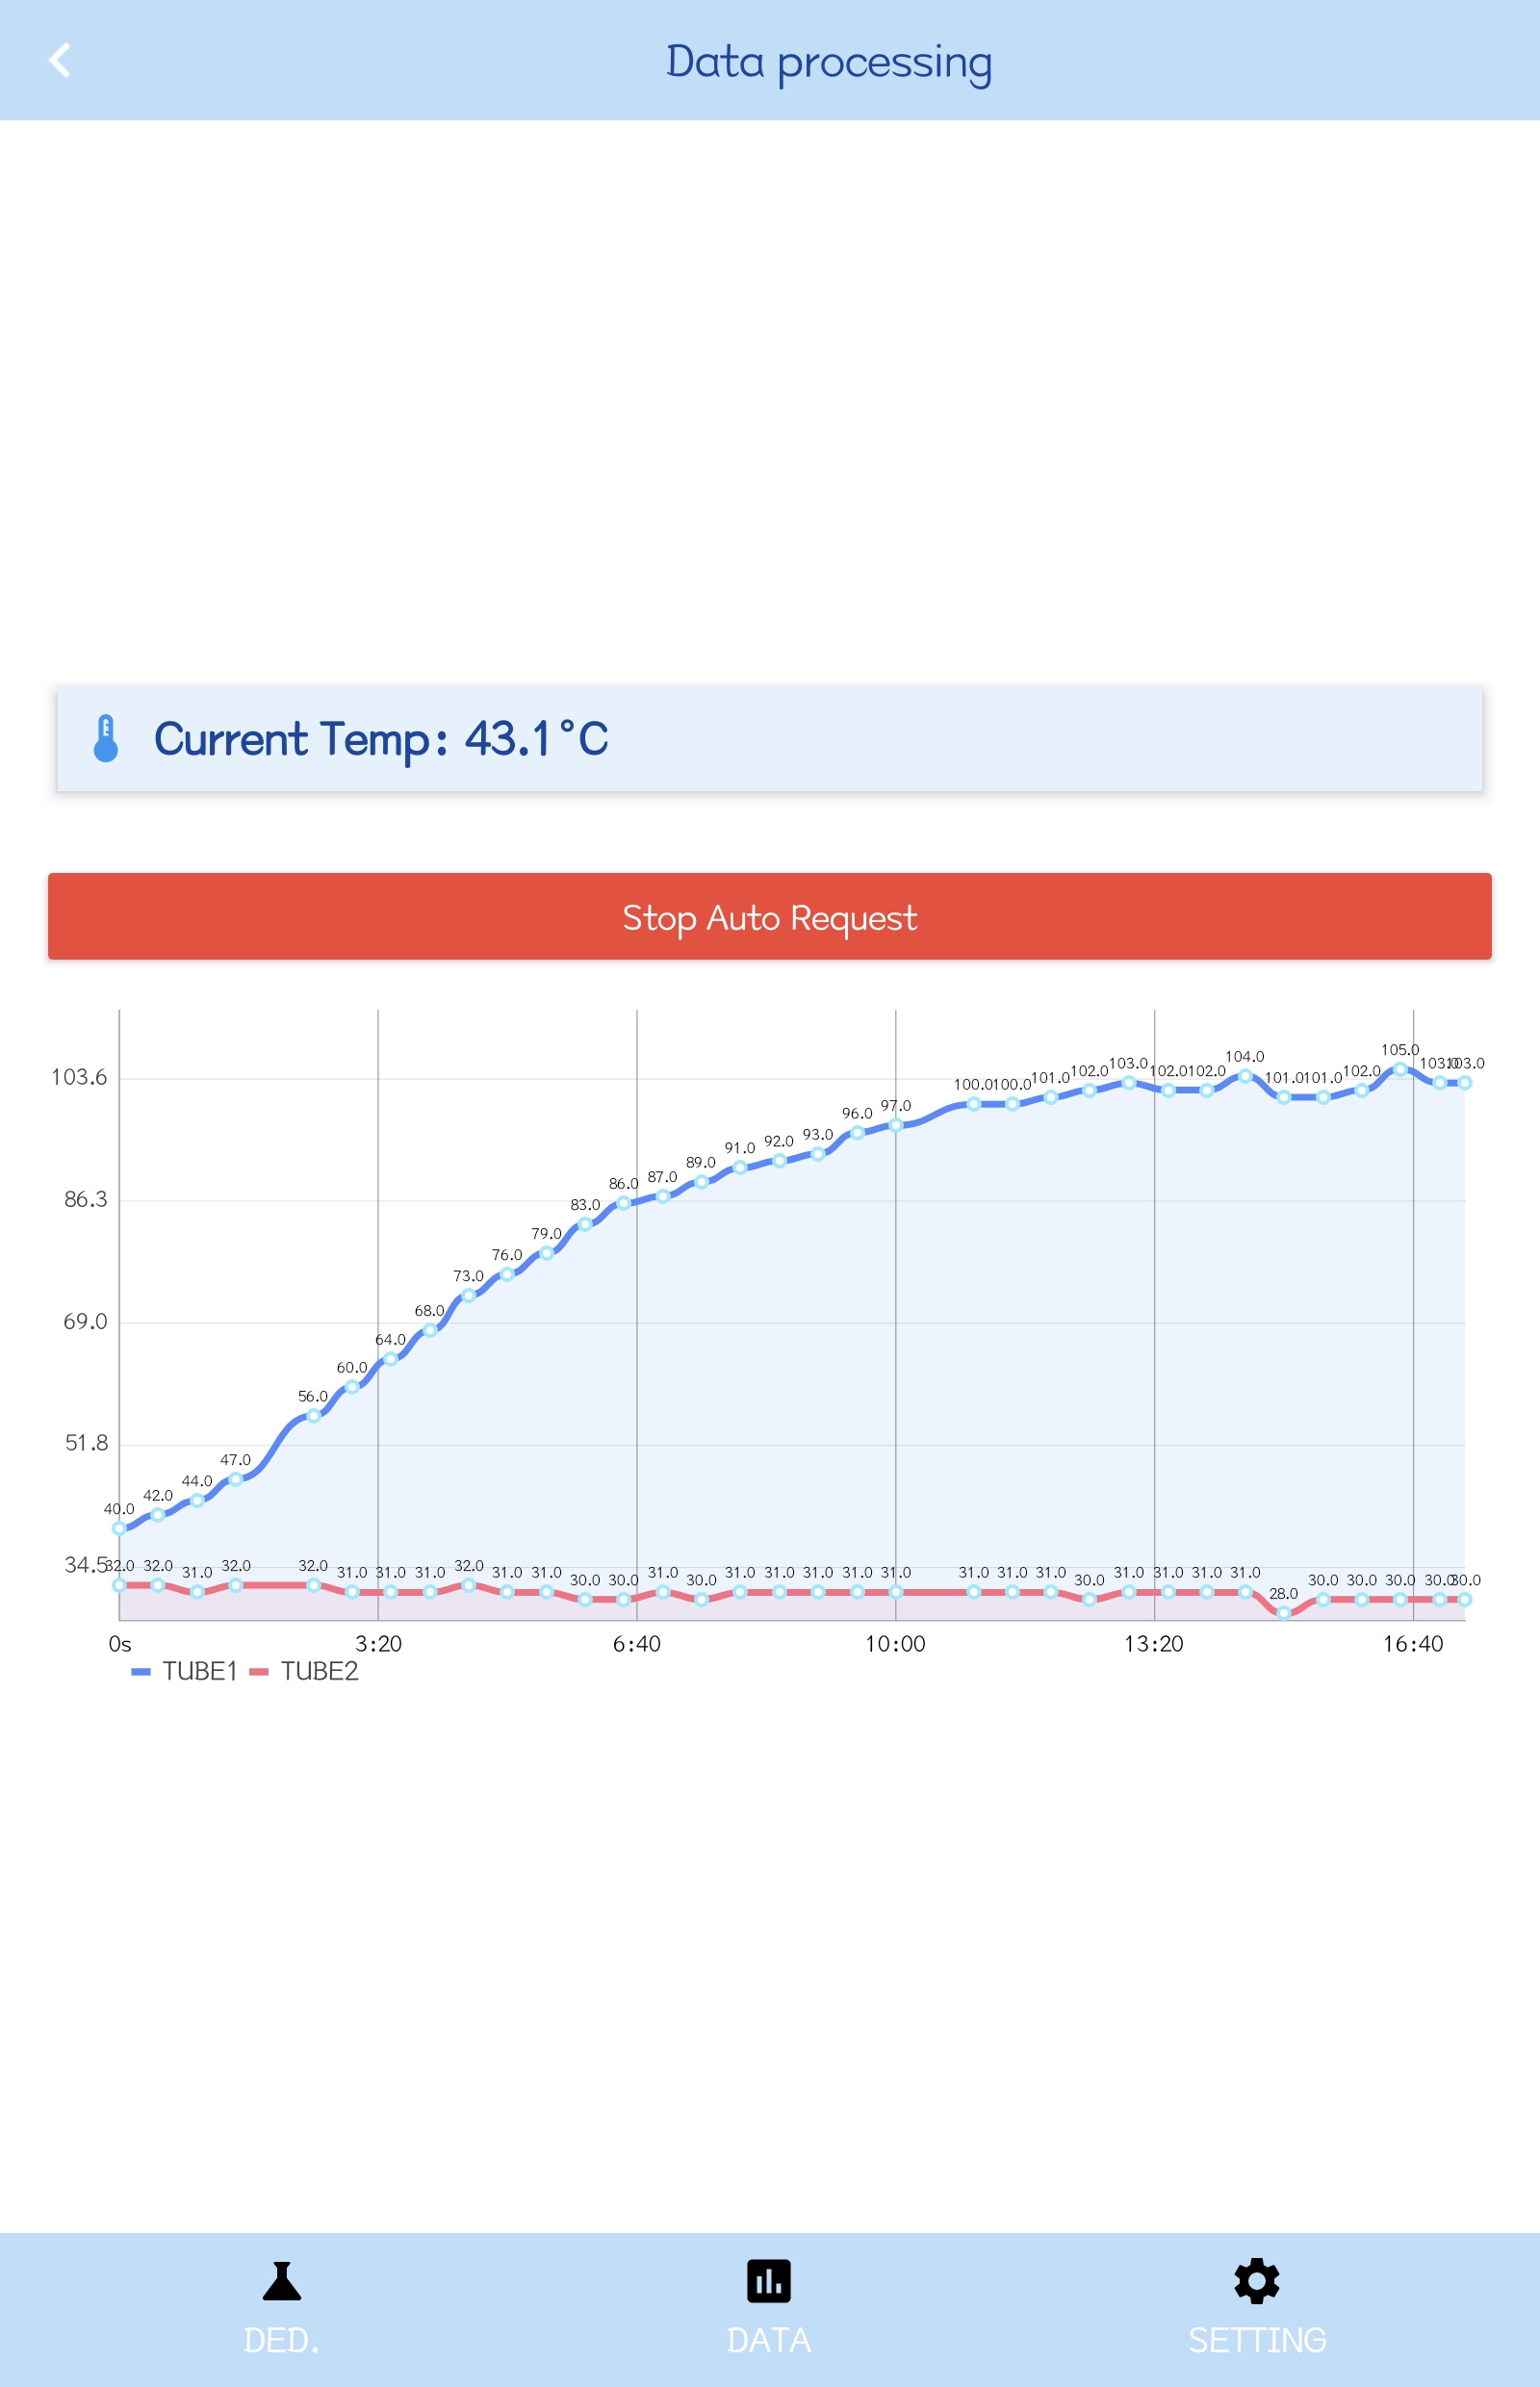
Display the two received curve values as TUBE1 and TUBE2 over time.
Receive analysis results
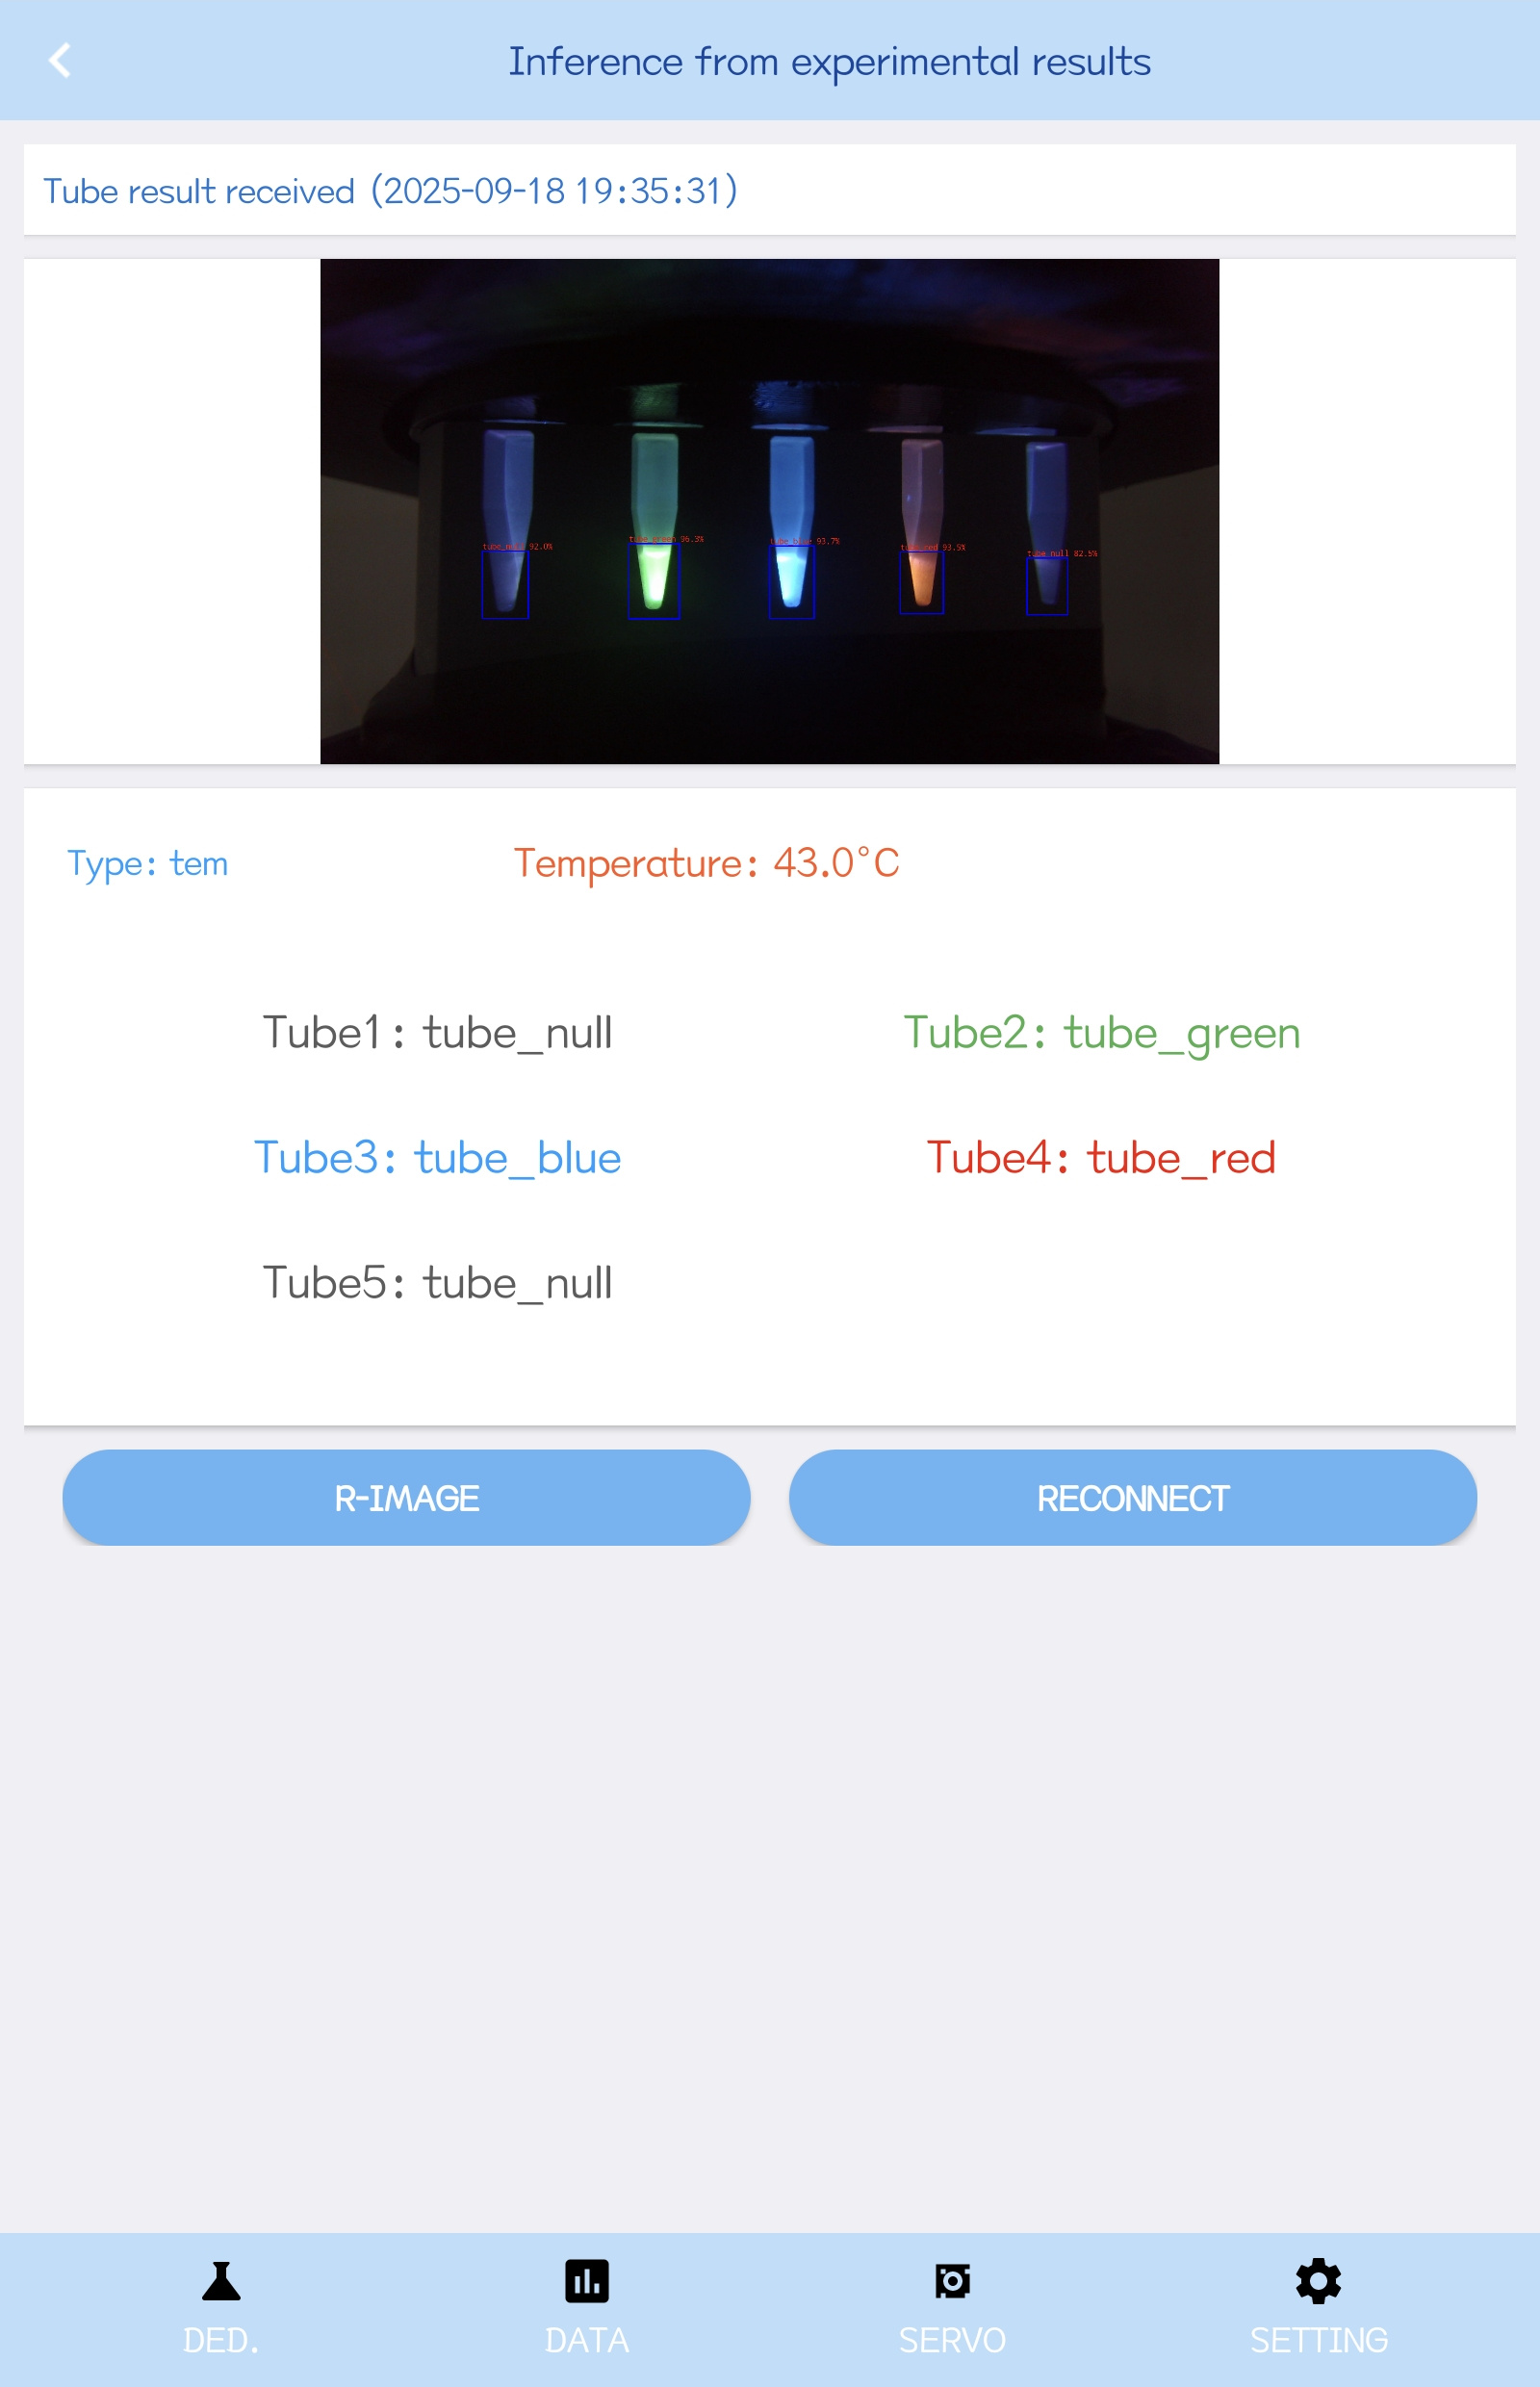
Request an image and display the tube labels returned by device-side analysis.
View and save images
Inspect the acquired image in the app and retain it through the image-viewing and saving functions.
One data flow
- 1Connect over Wi-Fi
- 2Send parameters
- 3AI Box acquires and analyzes
- 4Return temperature, curves, images and labels
- 5App displays results
Developing alongside the detector
The mobile interface began with device connection and expanded to support control, reaction monitoring, acquisition, and result viewing.
- Stage 1
Establishing the connection
Need: a direct mobile interface for connecting to the instrument. Added: the app interface and device communication for sending basic commands.
- Stage 2
Displaying the reaction
Need: visibility into temperature, elapsed time, and fluorescence. Added: heating countdown, temperature display, and live curves; separate control switches in the second generation.
- Stage 3
Presenting the results
Need: viewing the acquired image alongside device-side analysis. Added: two-tube results in the first generation, then five color-coded labels and servo control in the second.
Architecture
Connection and Communication
The mobile app and AI Box connect over a local Wi-Fi network. The device connection settings are IP address 10.42.0.1 and port 8080. The Android app acts as a TCP client and sends control commands as UTF-8-encoded JSON.
Each message consists of an 8-byte header followed by a payload. The header contains two big-endian 32-bit integers specifying the payload length in bytes and the data type: 0 for text and 1 for images.
Written in Java, the app handles connection management, countdowns, temperature and servo commands, and image and curve display. NetworkService handles TCP messages, while MainActivity manages user interaction and display. Other teams can adapt the communication parsing and MPAndroidChart plotting logic by adjusting the device protocol and interface bindings.
Device Software and App Integration
To let users control the device and view results on a phone, we handle interaction and display in the Android app, while AI Box handles temperature control, image acquisition, and analysis. The app sends TCP control commands over local Wi-Fi. The device executes the requested operations and returns temperature readings, images, and tube labels.
First generation. The first-generation device reads an 18B20 temperature sensor and uses a PID algorithm to adjust the PWM output and regulate heating power. The RK3588 runs YOLOv8n to locate reaction tubes, and OpenCV analyzes fluorescence signals within the image regions. The app receives the returned data and displays curves and results.
Second generation. The second generation retains this division of tasks and adds two temperature-control switches and a servo-control interface for the separate lysis area and rotating reaction chamber. The app sends control requests and displays five tube labels returned by the device. Device-side software acquires images and analyzes individual tubes after each change of viewing face.
For the detector design and device workflow, see our Hardware page.
Code Example: Requesting an Image
Once connected, the app constructs an image request and passes it to NetworkService. The following excerpt is from the image-request button handler in the second-generation MainActivity.java.
JSONObject requestJson = new JSONObject();
requestJson.put("action", "get_image");
requestJson.put("client_id", "android_1");
networkService.sendMessage(requestJson.toString());
NetworkService packages the JSON payload into a TCP message according to the communication protocol. The protocol documentation provides the complete command list, response fields, and message format.
Commands and Returned Data
Control commands: Both generations use get_image to request images, get_tem to request temperature readings, and set_tem to send a temperature-control value. The second generation also uses set_tem43 and set_tem90 for the two temperature-control switches, and set_servo for servo control.
Returned data: Response fields include type (message type), content (a string payload), and an optional timestamp. In the second generation, tubeluminance carries two curve values, data1 and data2. The app records the curve time when it receives the data; tem messages update temperature independently. Full field definitions and examples are available in docs/PROTOCOL.md in the repository.
The following temperature-response payload illustrates the format:
{"type":"tem","content":"25.0"}The second-generation app maps tube-label codes 0, 1, 2, and 3 to green, red, blue, and empty labels. Their biological interpretation follows the assay.
Validation
Device connection and acquisition
The connection screen uses the AI Box address 10.42.0.1 and port 8080. After the connection is established, the app displays the service status and can enter the data-acquisition workflow.
Temperature and fluorescence-curve display
The data screen displays the current temperature and updates two fluorescence curves over elapsed time. The two recorded screens show temperatures of 43.1 °C and 43.0 °C. TUBE1 and TUBE2 values update during acquisition.
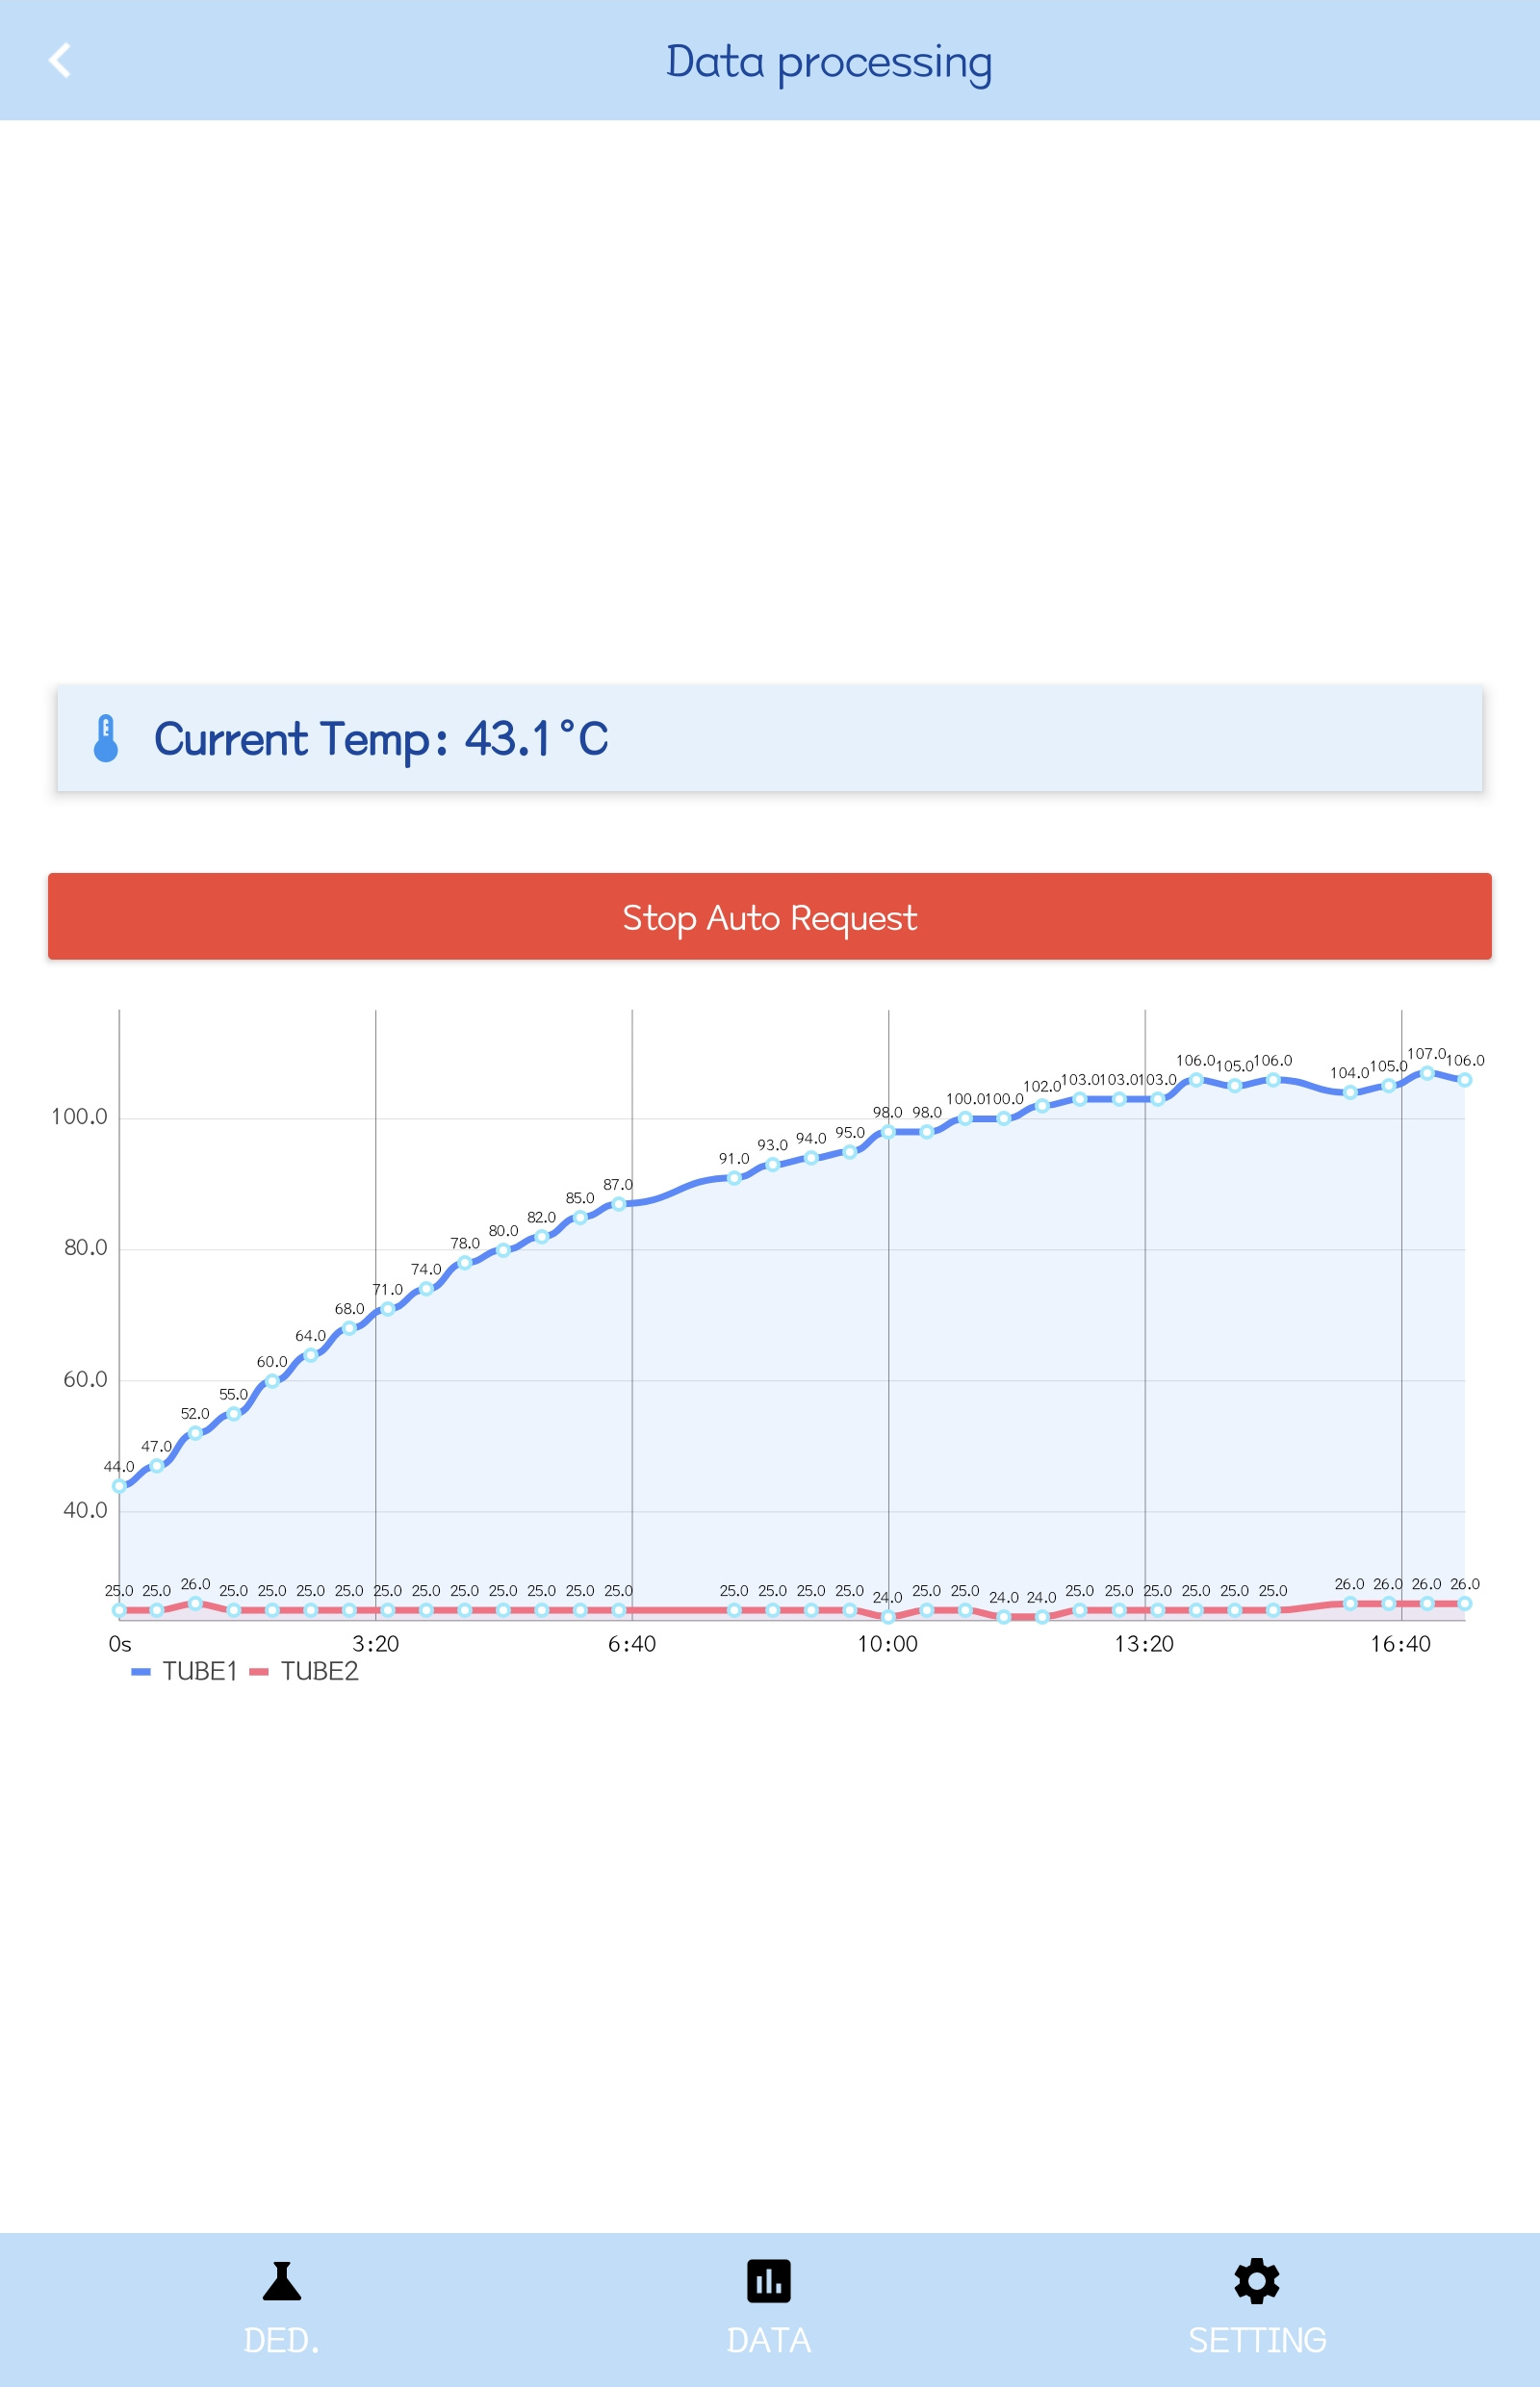
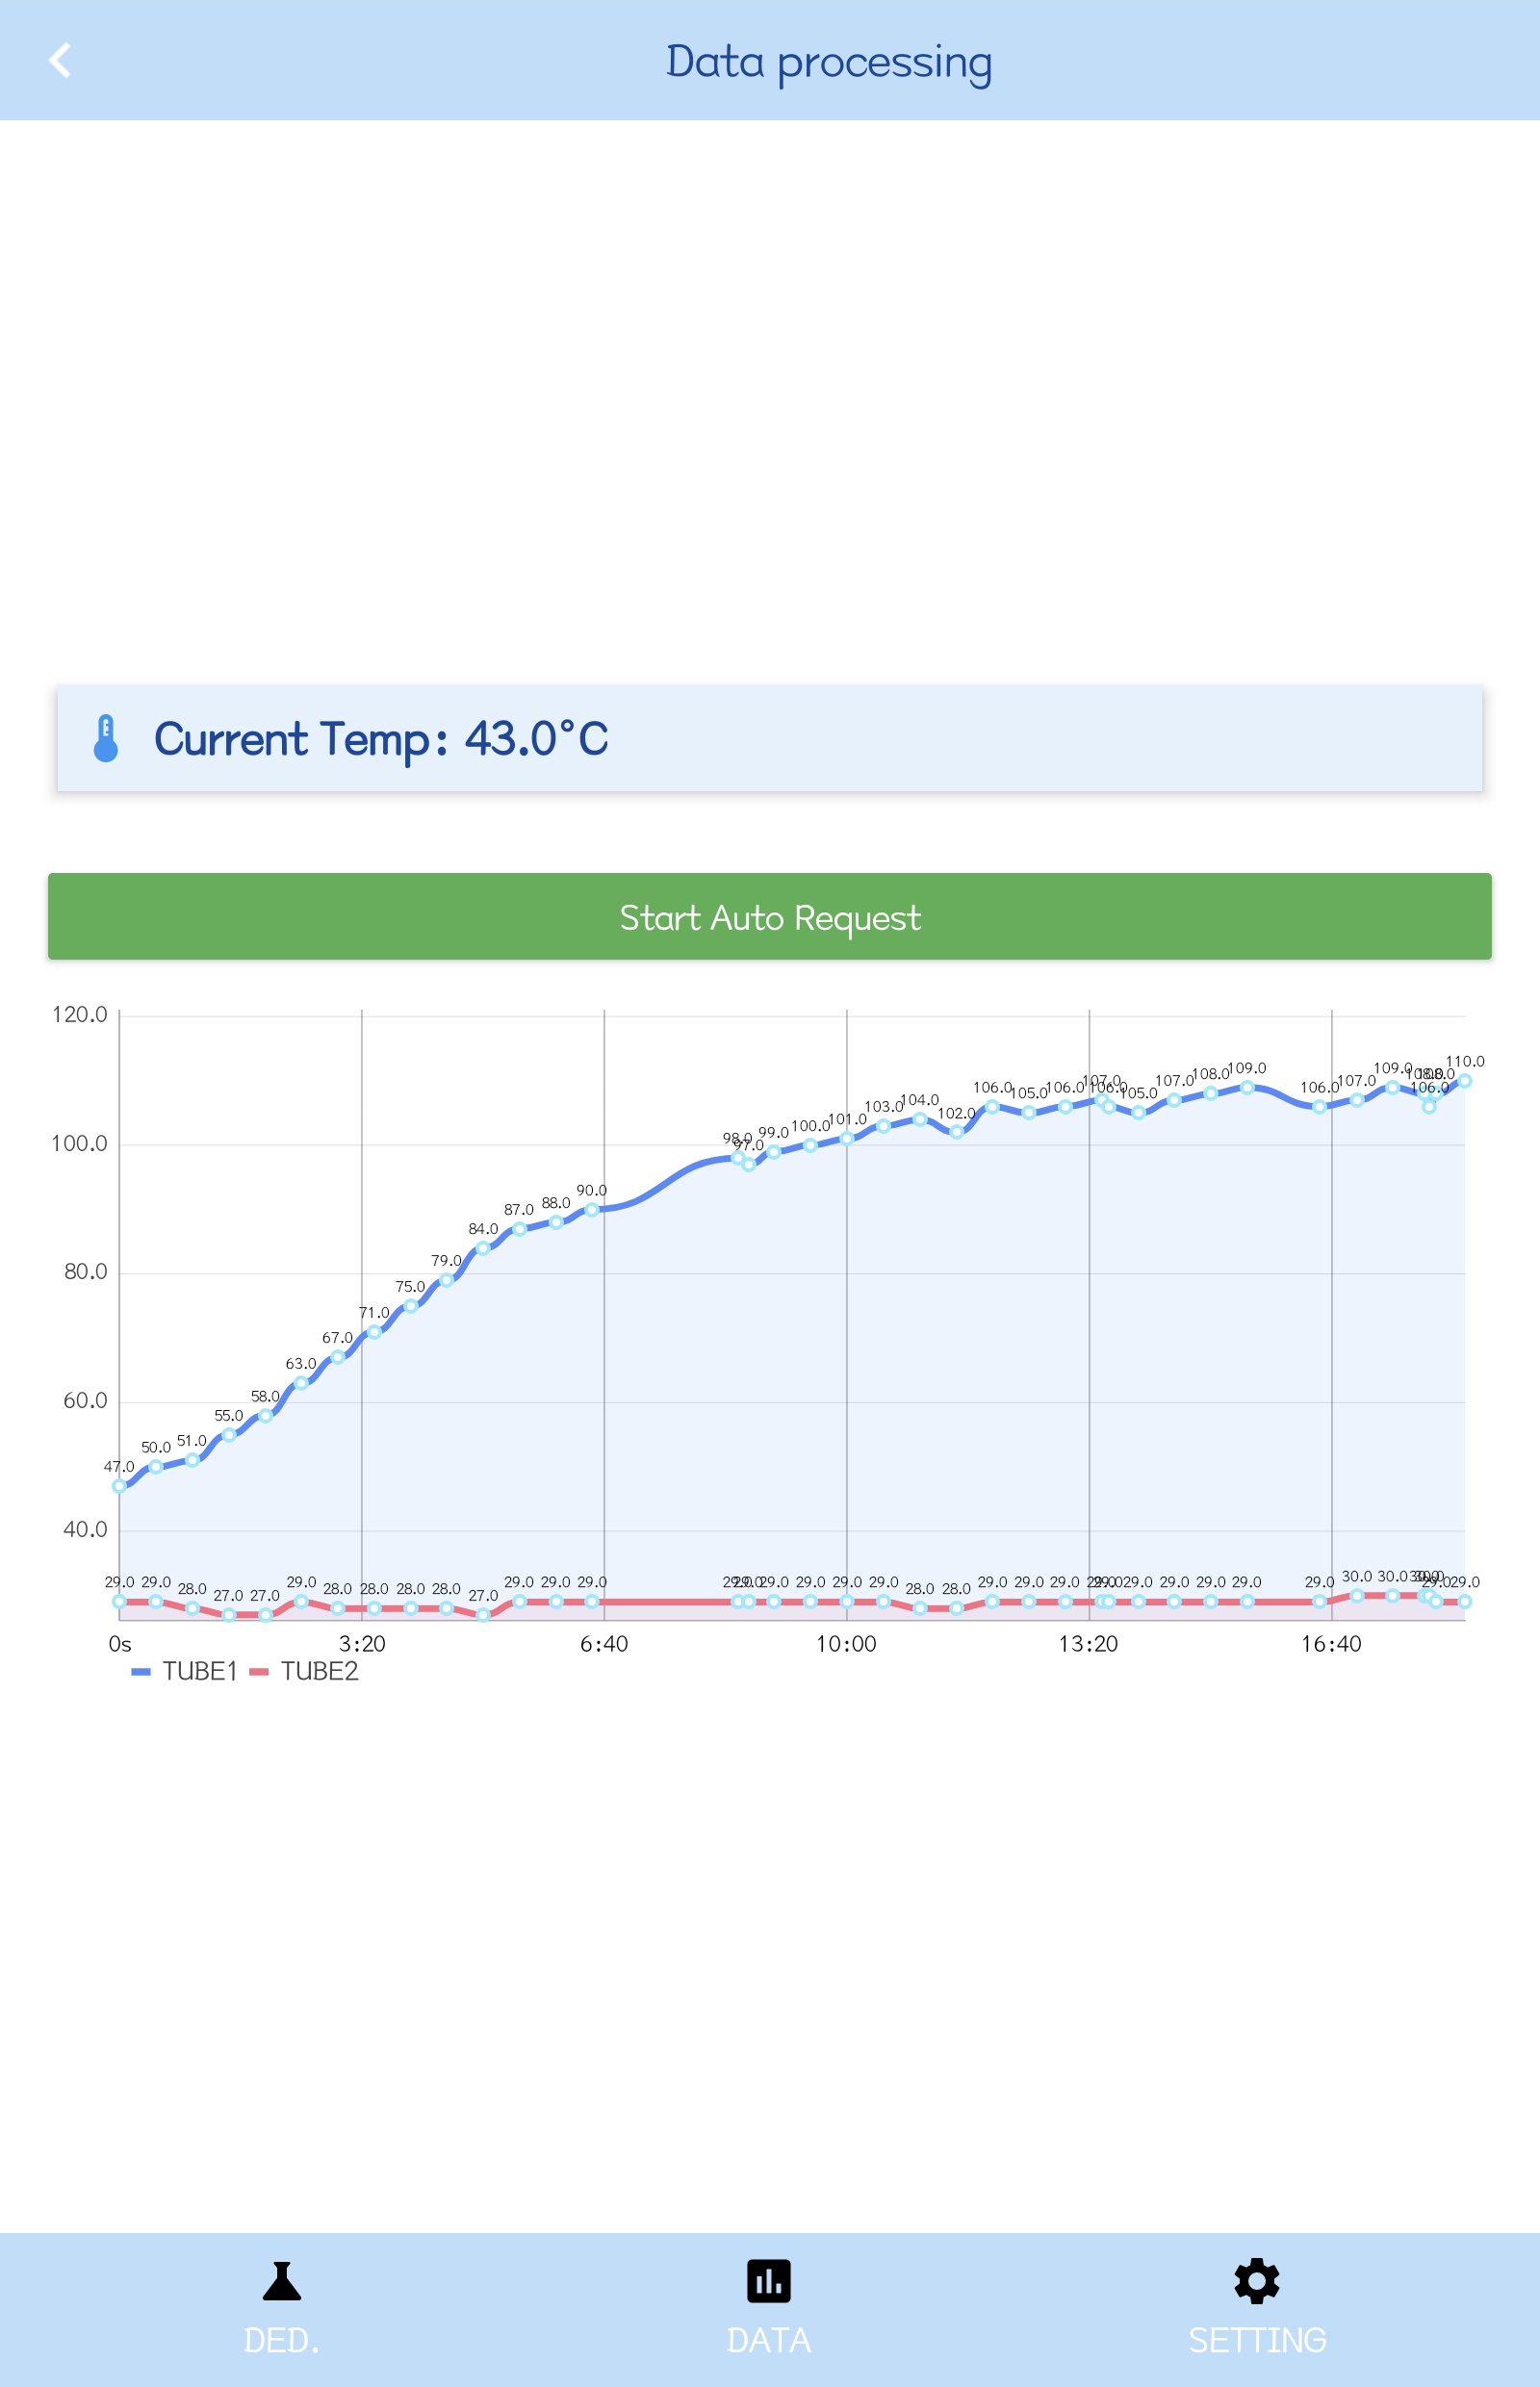
Image results and five tube labels
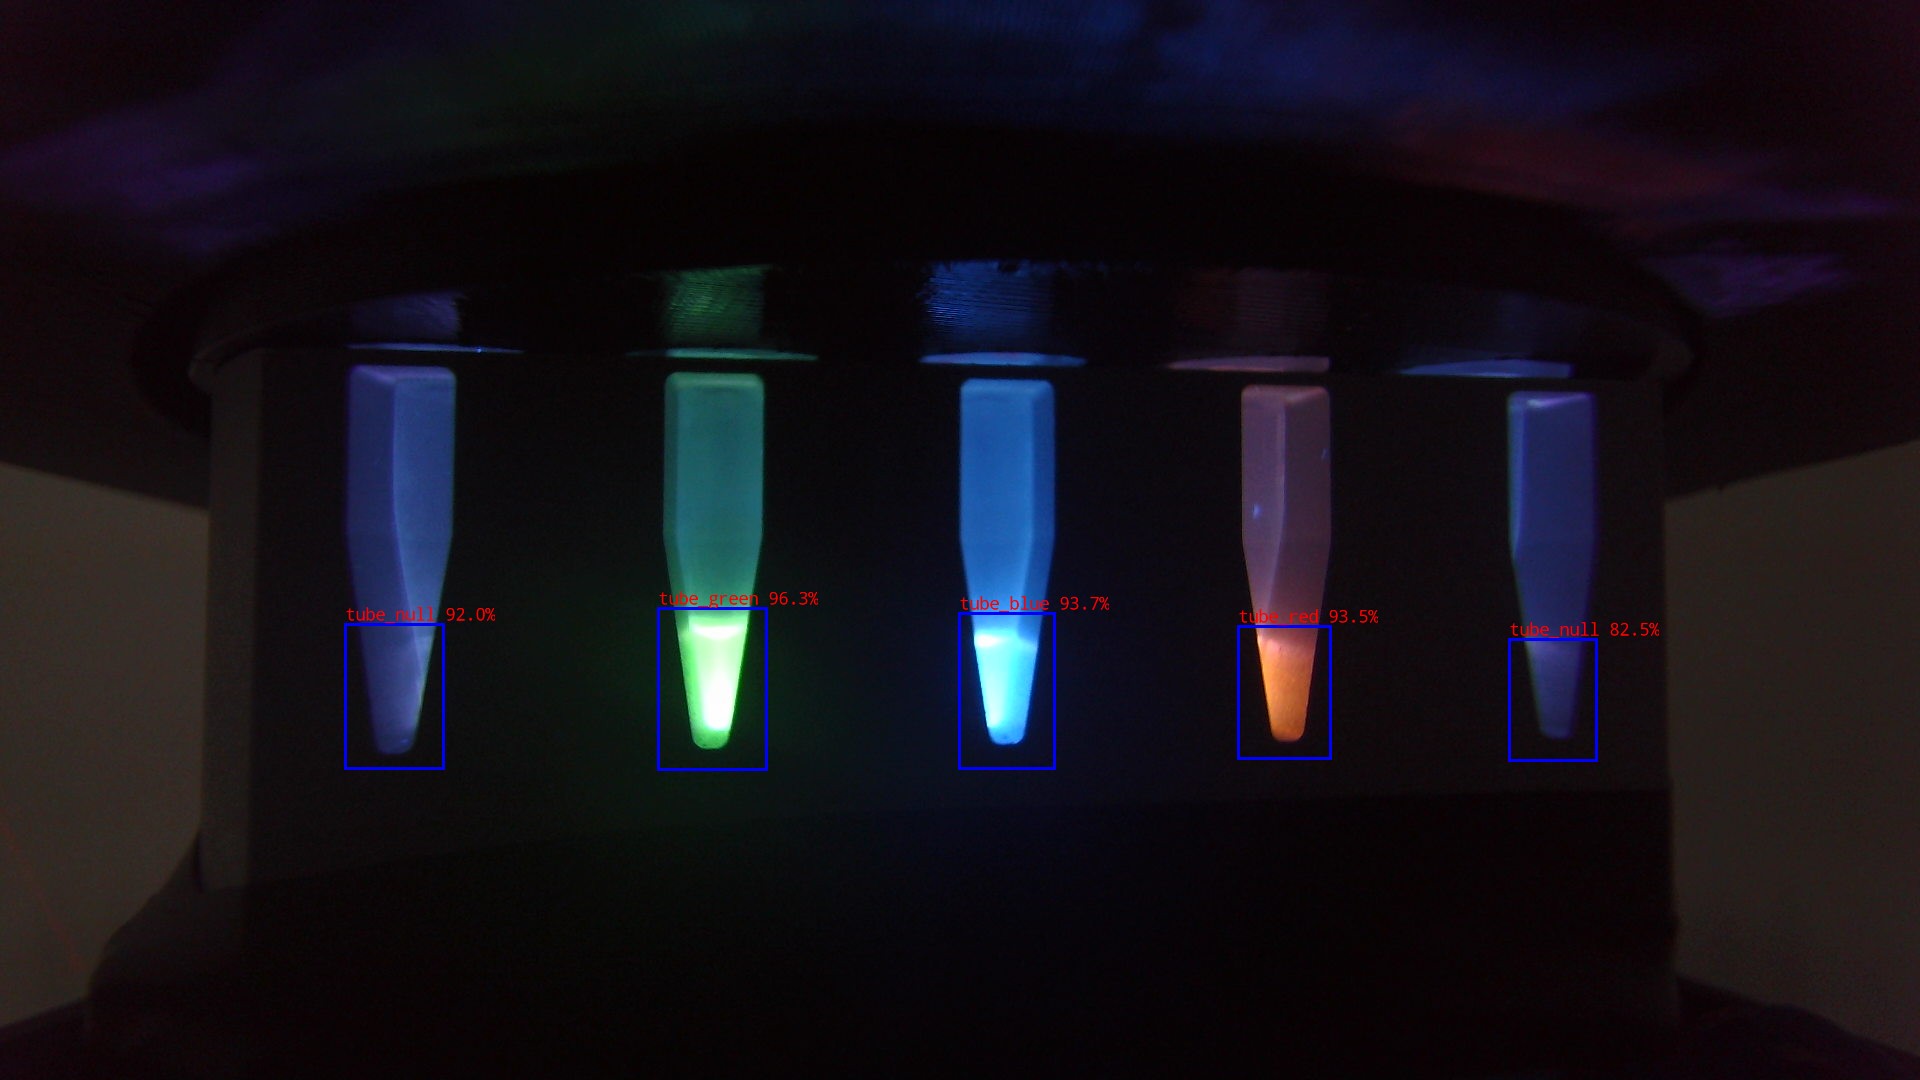
The result screen receives an image from the AI Box and displays five tube labels. In the example shown, Tube2 is labelled tube_green, Tube3 tube_blue, Tube4 tube_red, and Tube1 and Tube5 tube_null. The screen also shows a temperature of 43.0 °C.
Reusability
We integrated device control, reaction parameters, and detection status into the mobile interface. Users can connect the device, configure parameters, monitor the reaction, and view results without switching between separate programs.
The operating screen groups the heating time, temperature-control switches, and image requests. Connection status, temperature, and two-channel fluorescence curves update with data returned by the device. Other teams may reuse the communication parser, curve display, and result-display modules by adapting the commands and field mappings to their device protocol.
Build from source
- Open one generation directory as a separate Android Studio project.
- Select JDK 17 as the Gradle JDK and install Android SDK Platform 34.
- Synchronize Gradle, then select the
appconfiguration and run on Android 7.0 / API 24 or later.
The projects use Gradle 8.2 and Android Gradle Plugin 8.2.0. From the selected project directory in PowerShell:
.\gradlew.bat assembleDebugThe corresponding server and model require separate configuration. Read the full build and verification notes.
User Guide
Choose the illustrated manual for your app generation. Both eight-page guides cover instrument preparation, app operation, monitoring, result recording, and troubleshooting. Full acquisition and device control require a compatible AI Box server on a network reachable from the phone.
A · First-generation manual
ByeGerm 1.0 User Manual
An eight-page illustrated manual covering preparation, sample handling, app setup, reaction monitoring, result recording, and troubleshooting.
Download first-generation APK ↗B · Second-generation manual
ByeGerm 2.0 User Manual
An eight-page illustrated manual for the second generation, including two loading areas, batch loading, rotation controls, image acquisition, and troubleshooting.
Download second-generation APK ↗Hardware resources: Hardware manual (to be added) · Hardware operation video (to be added). These temporary links open the Hardware page; final manual and video entries will be added here.
Quick start
- Install. Download the matching APK for Android 7.0 / API 24 or later. Both supplied app generations declare version 1.0.
- Connect. Start the compatible AI Box server, join its network, and enter the actual IP address and port. The recorded setup uses
10.42.0.1:8080. - Configure and monitor. Set heating time and the controls supported by the device and assay. Confirm returned status and temperature; inspect the curve labels available in your app build. Follow the generation-specific manual for version differences.
- Request and inspect. Request an image, inspect the returned tube labels, and use image viewing or saving as needed. Interpret labels according to the assay.
If the connection or data does not update
Check that the device server is running, the phone can reach its network, and the IP address and port match the device. Reconnect and request an update. Empty or unchanged plots alone do not establish a negative assay result. Record the app generation, Android version, and observed status when reporting an issue.
Open Source
The repository provides the Java source projects for both app generations, Gradle configuration, a README, and TCP/JSON protocol documentation under the Apache License 2.0. Dependencies keep their own licenses and attribution requirements.
Supplied APK downloads
First generation
Version 1.0 · Android 7.0+com.chuangxin.socket_test
Two-tube result display.
Second generation
Version 1.0 · Android 7.0+com.chuangxin.socket
Five tube labels, servo control and two temperature-control switches.
Both APKs are team-supplied binaries with the debuggable manifest flag enabled; they were not rebuilt from the repository during publication. File hashes and package metadata are listed in the download metadata. A reachable download does not establish successful installation or device operation.